How To Guide
Configure AWS CloudWatch
This guide will help you set up AWS CloudWatch integration with Unmeshed to monitor your processes and workflows.
Prerequisites
Before configuring AWS CloudWatch, ensure you have:
- Create AWS IAM User
Create AWS IAM User
- Login to AWS Console and navigate to IAM service
- Create a new IAM user with programmatic access
- Attach the following policy to the user:
CloudWatchAgentServerPolicy- Required for sending metrics to AWS CloudWatch
Add CloudWatch Integration
- Navigate to the Unmeshed Dashboard
- Go to Integrations in the left sidebar
- Filter by "Monitoring" category
- Find "Amazon CloudWatch" in the integrations list
- Click "Add +" to enable the CloudWatch integration
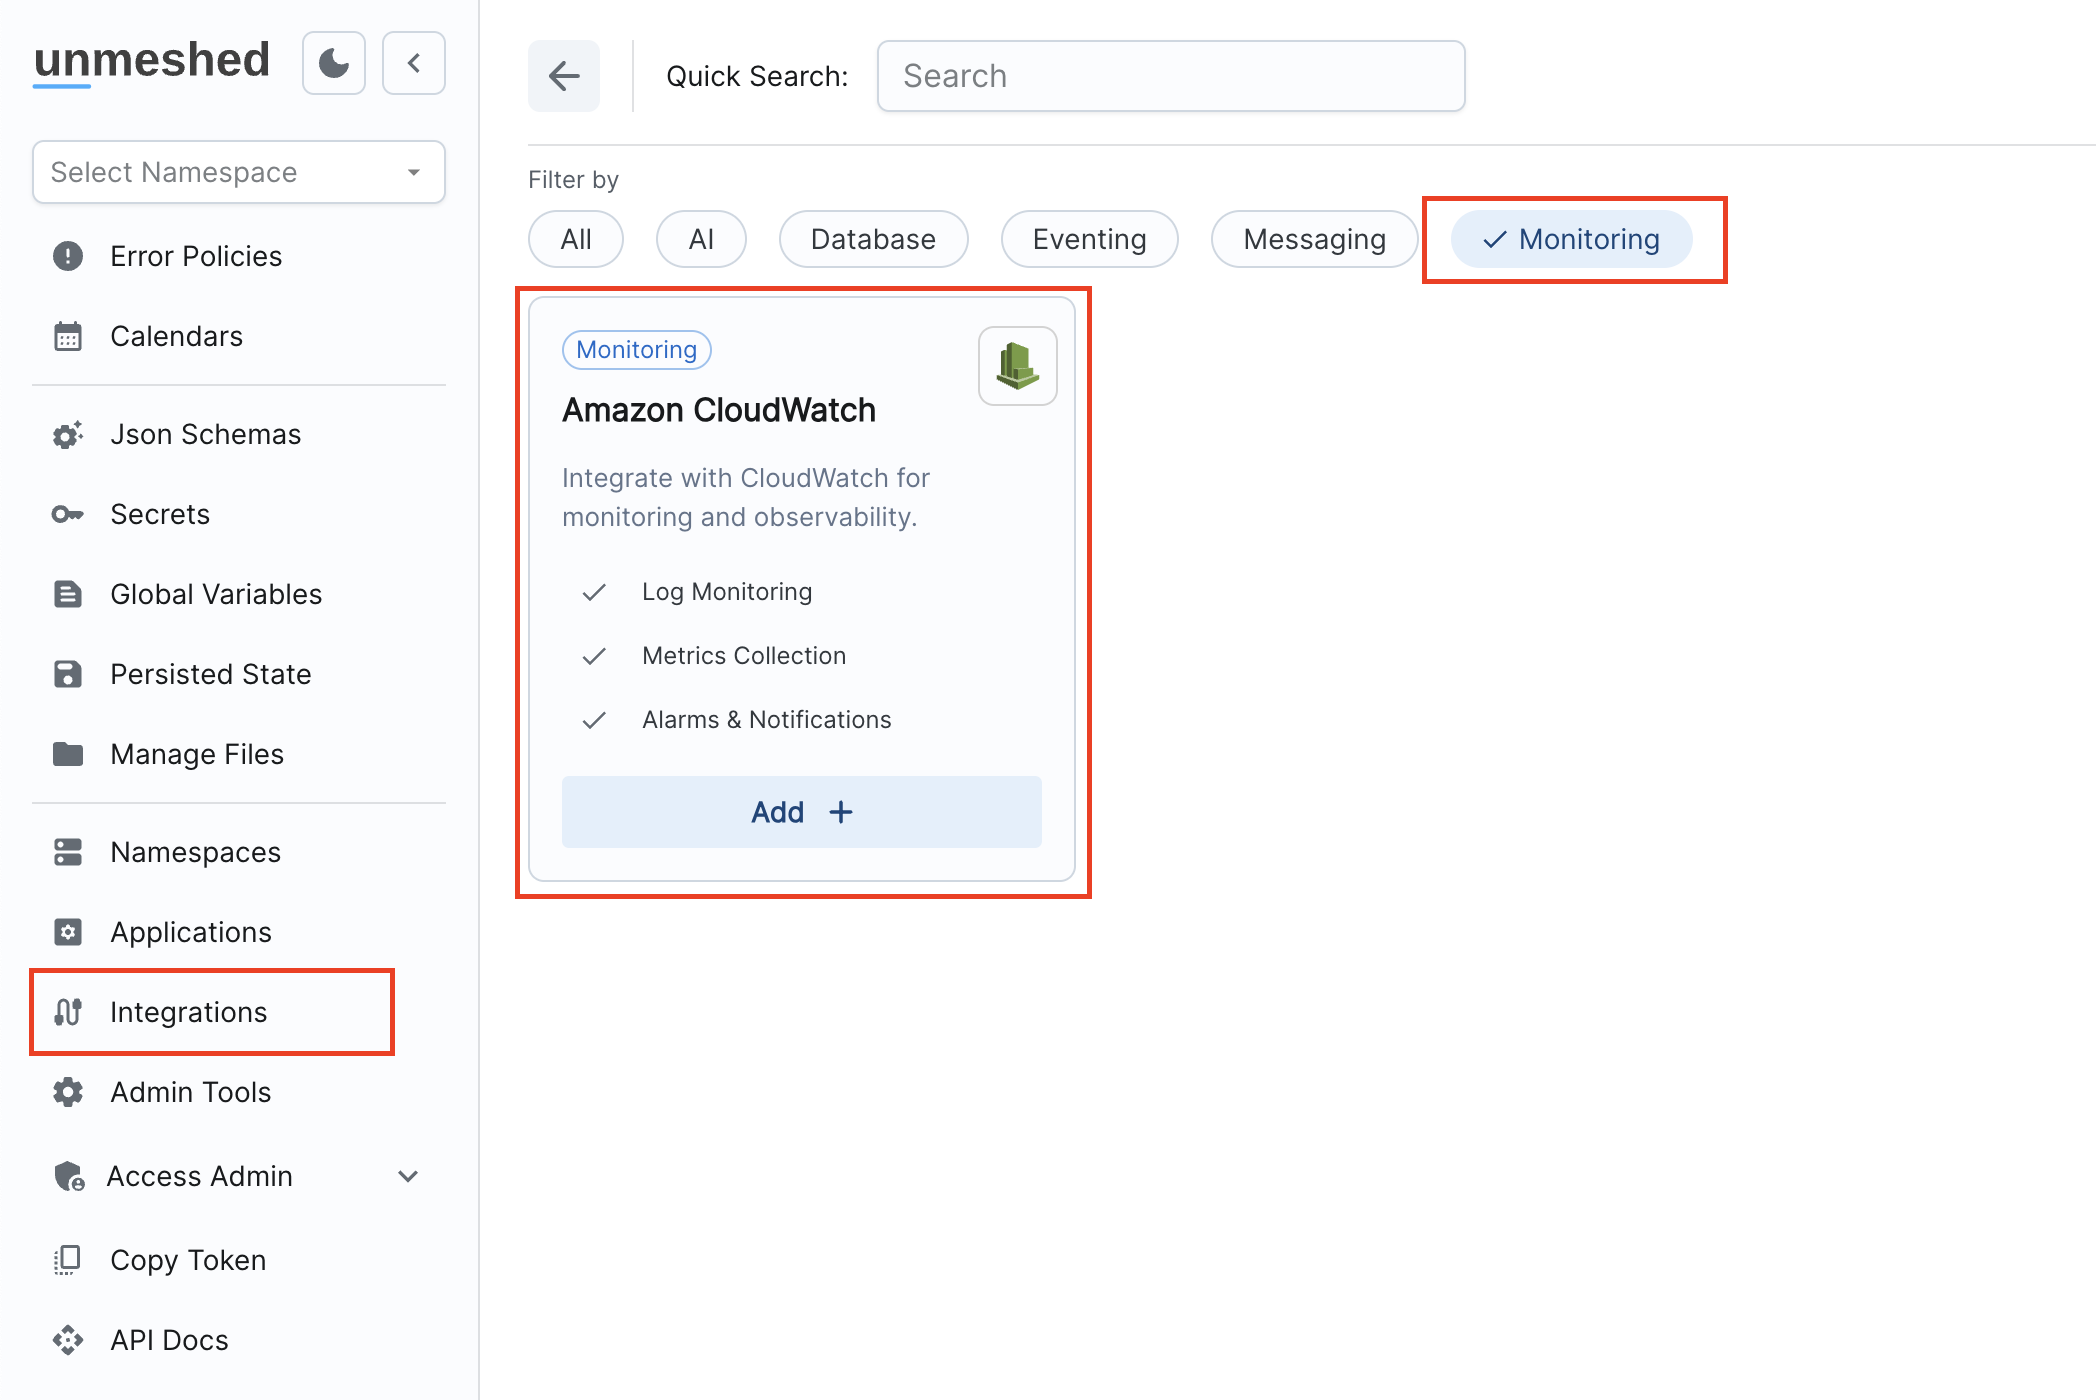
The integration page showing the "Add +" button to enable publishing metrics from Unmeshed to AWS CloudWatch.
Configure CloudWatch Integration
After clicking "Add +", you'll be taken to the CloudWatch integration configuration screen. Here's what you need to configure:
Basic Configuration
-
Name: Enter a suitable name for your integration
- Use underscores (_) or hyphens (-) and avoid spaces
- Example:
my-cloudwatch-integration
-
Enabled: Check this box to activate the integration
Enabling/disabling takes up to 30 minutes to take effect
AWS Configuration
-
Metric Namespace: Enter the CloudWatch namespace where your metrics will be stored
- Example:
MyApp/MetricsorUnmeshed/Processes - This namespace will appear in AWS CloudWatch
- Example:
-
Access Key: Enter the AWS access key for the IAM user with
CloudWatchAgentServerPolicy -
Secret Key: Enter the AWS secret key for the IAM user
-
Region: Select the AWS region where you want to publish metrics
- Choose the region closest to your application or where your CloudWatch is configured
Process Configuration
Configure how process-level metrics are collected and sent to CloudWatch:
-
Process Metric Name: Enter a descriptive name for your process metrics
- This name will be used in CloudWatch to identify your process metrics
- Example:
unmeshed_process_executions
-
Process Dimensions: Select dimensions to categorize your metrics
- Available dimensions: namespace, name, type, processId, id, status, requestId, correlationId
Avoid high cardinality dimensions such as id, processId, requestId, and
correlationId as they can cause performance issues and increased costs in
CloudWatch
id and processId represent the same value
-
Process Statuses Filter: Choose which process statuses to include
- Available statuses: PENDING, RUNNING, COMPLETED, FAILED, TIMED_OUT, CANCELLED
- Use "Select All" to include all statuses
- For detailed information about process statuses, see Process Status
-
Process Names Filter: Choose which processes to monitor
- Use "Select All" to monitor all processes
- Or select specific process names to filter
Step Configuration
Configure how step-level metrics are collected and sent to CloudWatch:
-
Step Metric Name: Enter a descriptive name for your step metrics
- This name will be used in CloudWatch to identify your step metrics
- Example:
unmeshed_step_executions
-
Step Dimensions: Select dimensions to categorize your step metrics
- Available dimensions: namespace, name, stepRef, type, id, status
Avoid high cardinality dimensions such as id as they can cause performance
issues and increased costs in CloudWatch
-
Step Names Filter: Choose which step names to include
- Use "Select All" to include all steps
- Or select specific step names to filter
-
Step Refs Filter: Choose which step references to include
- Use "Select All" to include all step references
- Or select specific step references to filter
-
Step Statuses Filter: Choose which step statuses to include
- Available statuses: PENDING, SCHEDULED, RUNNING, COMPLETED, FAILED, TIMED_OUT, SKIPPED, CANCELLED
- Use "Select All" to include all step statuses
Save Configuration
Once you've configured all the settings:
- Click "Save" to apply your configuration
- Wait up to 30 minutes for the integration to take effect
- Verify in AWS CloudWatch that metrics are being published to your specified namespace