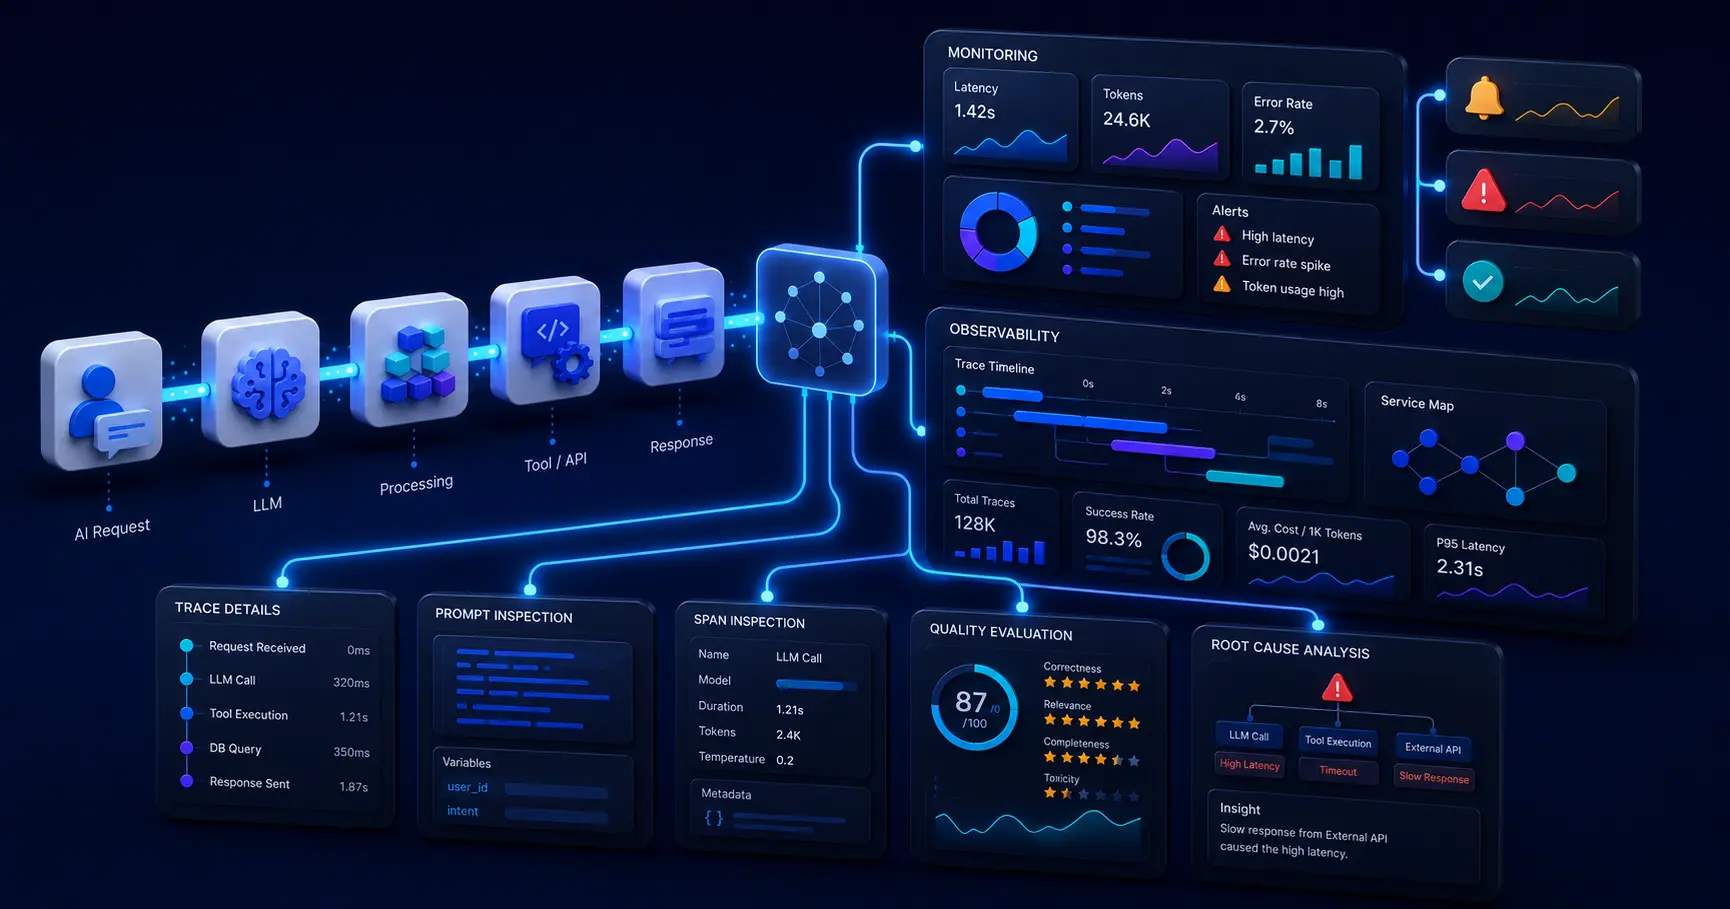
LLM observability tools help you see what your AI application is actually doing once it's live. Token spend, output quality, whether an agent looped somewhere it shouldn't have- all of that lives outside a normal error log.
As more backend teams put LLM calls inside real production workflows, not just a chatbot demo, picking the right LLM observability tools matters more than picking the flashiest one. Most tools in this space log what happened. Fewer of them tell you whether it was actually good, or show you the workflow the LLM call was sitting inside.
This is a plain look at eight LLM observability tools worth knowing in 2026, what each one covers well, and where each one leaves a gap. Some of these double as a general AI agent observability platform; others are narrowly built for one job and nothing else.
1. How We Evaluated These Tools
We looked at the same five things across every one of these LLM observability tools. Some of them are built around LLM tracing and evaluation from the ground up; others bolt observability onto a product that does something else first, and that distinction shapes most of what follows.
- Tracing depth: Does the tool see a single request, or the full multi-step process around it, including retries, branching, and human review?
- Evaluation vs. logging: Does the tool score output quality, or does it just record that a call happened?
- Real production cost: What does a team actually pay once usage moves past the free tier?
- Open source vs. lock-in: Can you self-host and inspect the code, or are you tied to a vendor's cloud?
- Who can use it: Engineers only, or can product managers and QA participate too?
2. The LLM Observability Tools at a Glance
| Tool | Description | Pricing | Open Source | Best For |
|---|---|---|---|---|
| Unmeshed | Workflow orchestration with step-level observability | Free forever; Premium $20/mo | No | LLM calls embedded in a larger workflow with retries, branching, and approvals |
| Langfuse | LLM engineering platform | Free tier; from $29/mo | Yes (MIT) | Self-hosted tracing with full data ownership |
| LangSmith | Observability and evaluation | Free tier; Plus $39/seat/mo | No | Teams built entirely on LangChain or LangGraph |
| Datadog LLM Observability | APM extension | From ~$8/10K requests/mo | No | Teams already running Datadog for infrastructure monitoring |
| Helicone | LLM observability and AI gateway | Free tier; Pro $79/mo | Yes (Apache-2.0) | Multi-provider proxy setups needing caching and failover |
| Portkey | AI gateway and LLM routing | Free tier; from $49/mo | Yes (MIT) | Production routing, fallbacks, and load balancing |
| Arize Phoenix | AI observability and evaluation | Free (Phoenix); AX from $50/mo | Yes (Elastic 2.0) | Notebook-first observability during experimentation |
| Confident AI | Evaluation-first observability | Free tier; from $9.99/seat/mo | No (self-host on Enterprise) | Teams that need automated quality scoring on every trace |
3. The Tools, Compared
Here's how eight LLM observability tools stack up once you look past the marketing page, starting with the one that approaches the problem differently from the rest of this list.
Worth a read: What Is LLM Observability and Why Your Production AI Needs It
A. Unmeshed
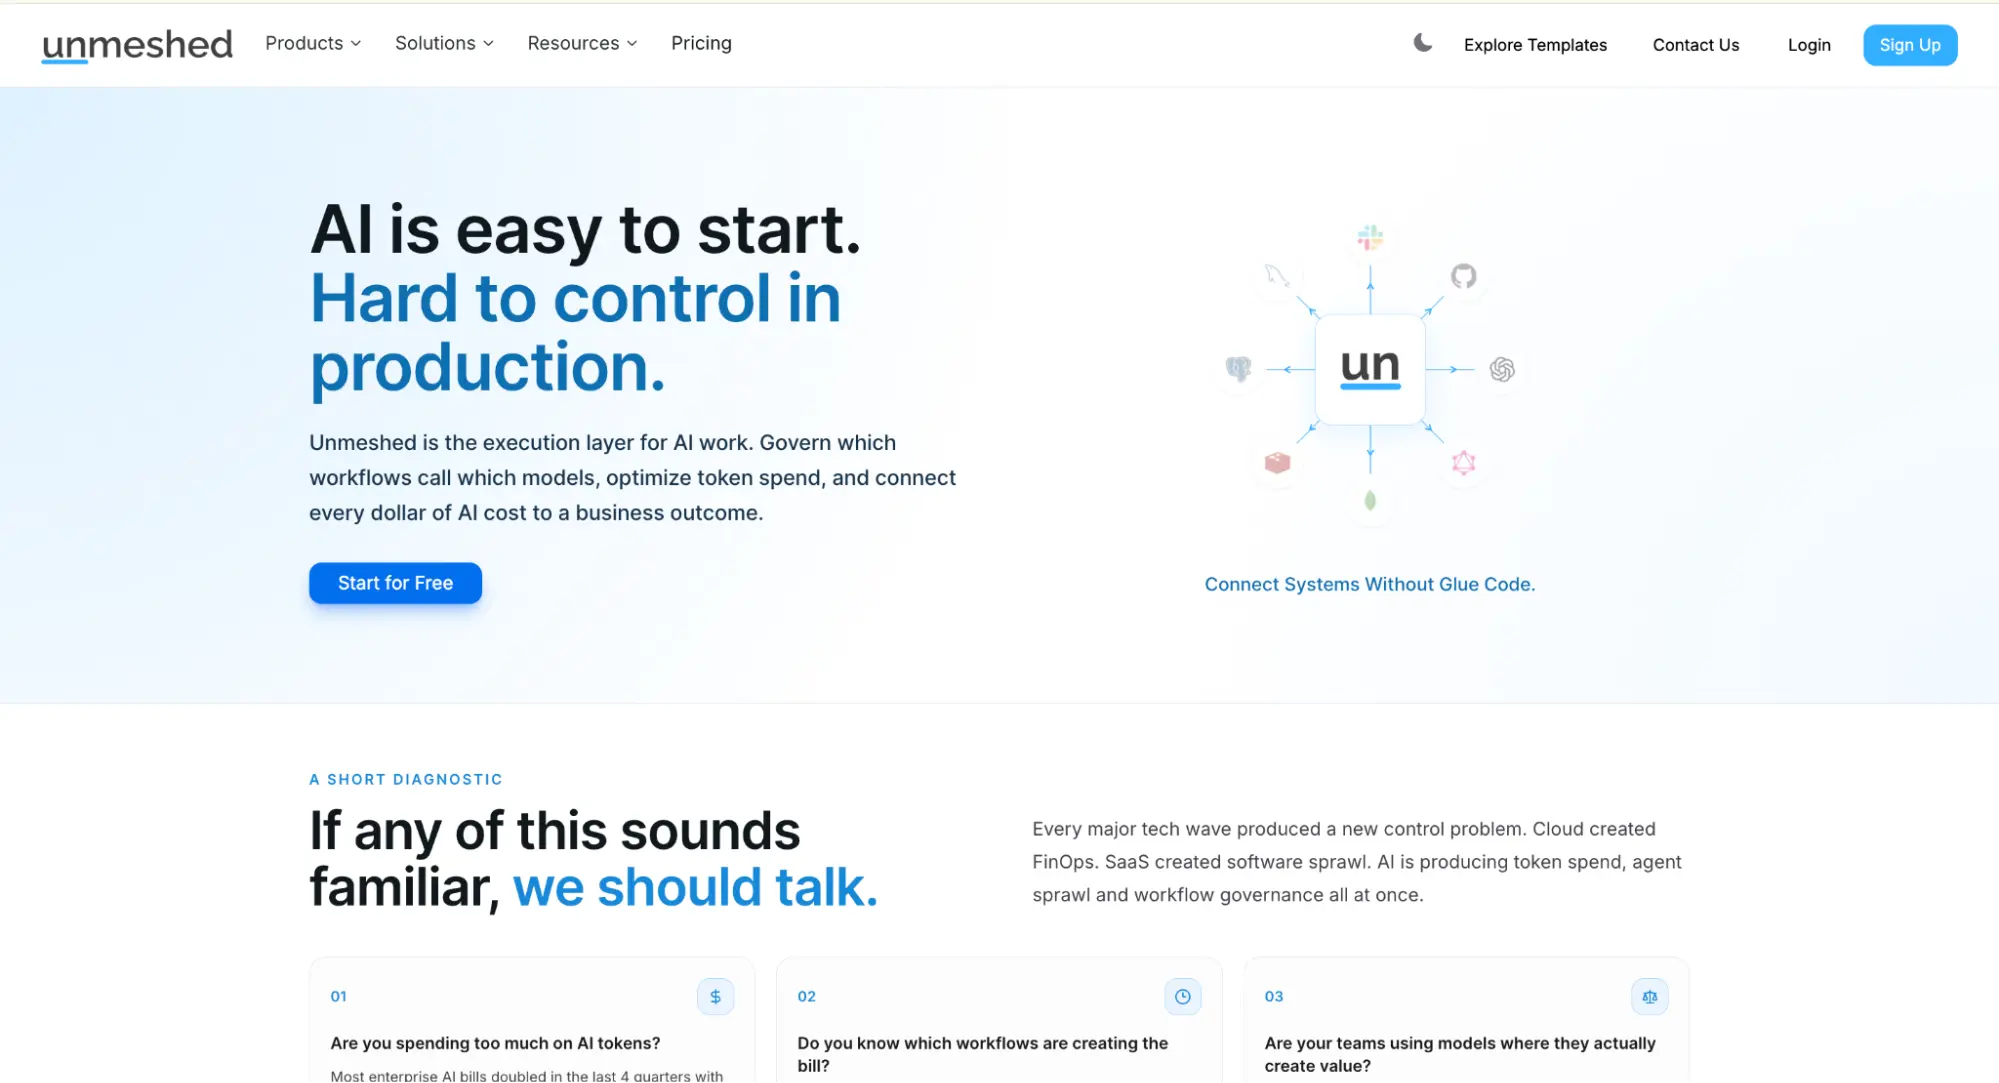
Unmeshed is a workflow orchestration platform built for the step that happens right before and right after your LLM call: the retry, the branch, the human approval, the call to three other services. That's the layer most observability tools never look at because they're built to trace the model, not the workflow it runs in.
What it gives you is workflow-level LLM visibility, step-level observability, and replay as a built-in platform feature, not an add-on, across every plan including the free tier. If your LLM call is one step inside a bigger process, Unmeshed shows you that whole graph, not just the isolated prompt and response.
AI agent calls run as a first-class step type alongside your deterministic code, so the same execution view that shows a JavaScript step or a decision table also shows the LLM step, in context, in the same run.
Features
- Step-level observability and replay on every workflow run, included on the Free plan
- AI agent calls as a native workflow step type, metered separately from workflow runs
- Governance controls over which tools an agent can call and how
- Human-in-the-loop approval steps built into the workflow definition
- Audit logs and role-based access control on Enterprise plans
Pros
- Step-level observability and replay ships as a core platform feature, so every run, including the LLM steps inside it, is inspectable after the fact without wiring up a separate tracing tool
- The LLM call sits in the same execution graph as your retries, branching, and approval steps, so debugging a failure means reading one workflow, not correlating logs across four systems
- Governance controls mean agent actions are auditable and policy-aware by default, not just logged after the fact
- Human-in-the-loop review sits directly inside the workflow, so a person can gate an agent's action at the exact point it happens, not in a disconnected review queue
- Deterministic steps and AI steps run in the same graph, so you get visibility into the entire business process around the LLM call, not just the prompt and response in isolation
Pricing
Free forever covers 1,000 workflow runs and 1,000 AI agent calls a month. Premium is $20 a month for 10,000 workflow runs and 10,000 AI agent calls. Enterprise is custom, with unlimited runs, seats, and agent calls.
B. Langfuse
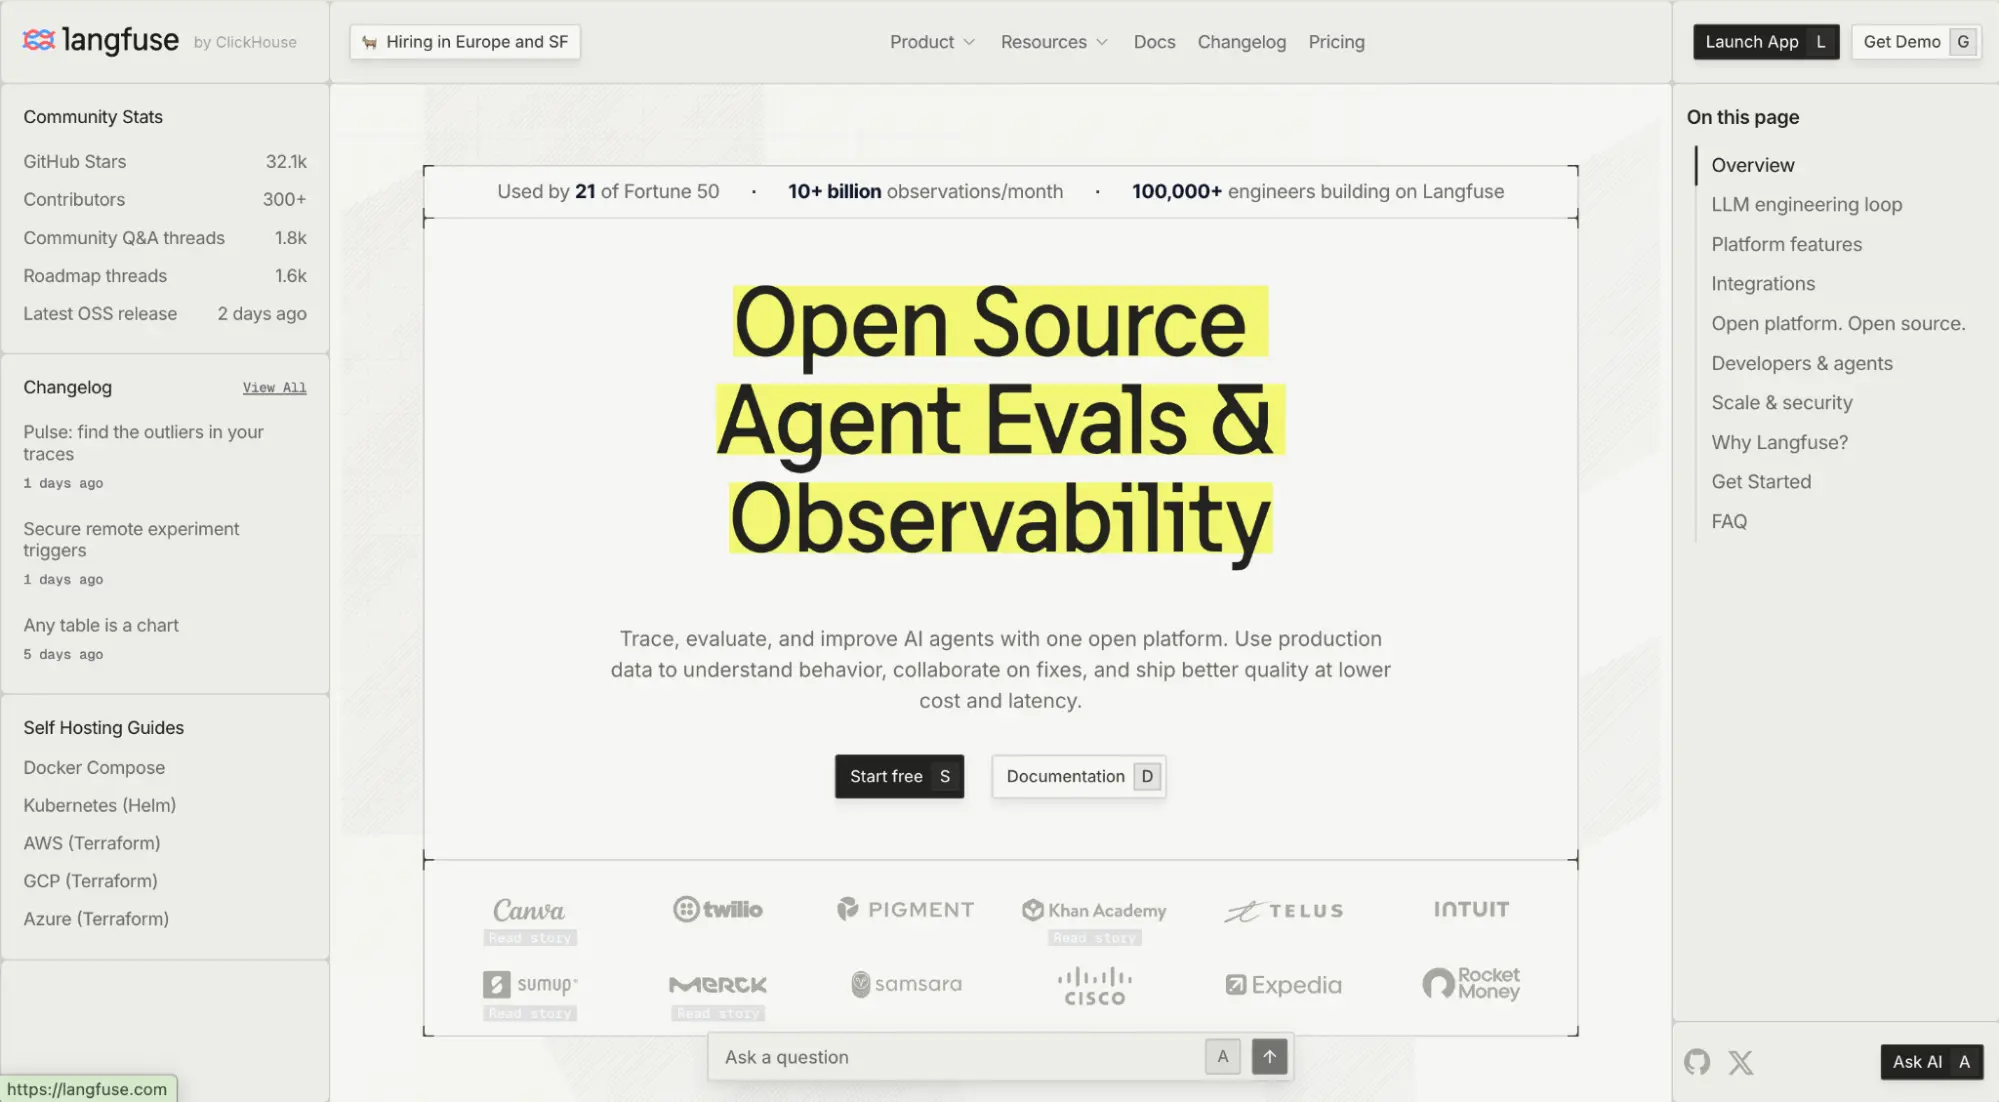
Langfuse combines tracing, prompt management, and evaluation hooks in a single open-source platform. The MIT-licensed core has made it popular with teams that want full control over their trace data through self-hosting, and community adoption backs that up, with over 21,000 GitHub stars.
Automated instrumentation via callback handlers captures traces without touching business logic, and it supports OpenAI SDK, LangChain, LlamaIndex, LiteLLM, Vercel AI SDK, Haystack, and Mastra.
Features
- OpenTelemetry-native trace capture covering prompts, completions, metadata, and latency
- Multi-turn conversation grouping at the session level
- Prompt management and versioning inside the platform
- Token usage dashboards with cost attribution across models
- Self-hosting via Docker for full data ownership
Cons
- No built-in evaluation metrics. Scoring faithfulness, relevance, or hallucination requires custom implementation or an external library
- No native alerting on quality degradation, so you won't get notified when output quality drops without building that yourself
- Native SDK support is limited to Python and TypeScript; other languages need API wrappers
- The self-hosted version has occasional bugs, and continued investment is less certain following the ClickHouse acquisition
Pricing: Free tier available. Paid plans start around $29 a month, with separate Enterprise pricing on request.
C. LangSmith
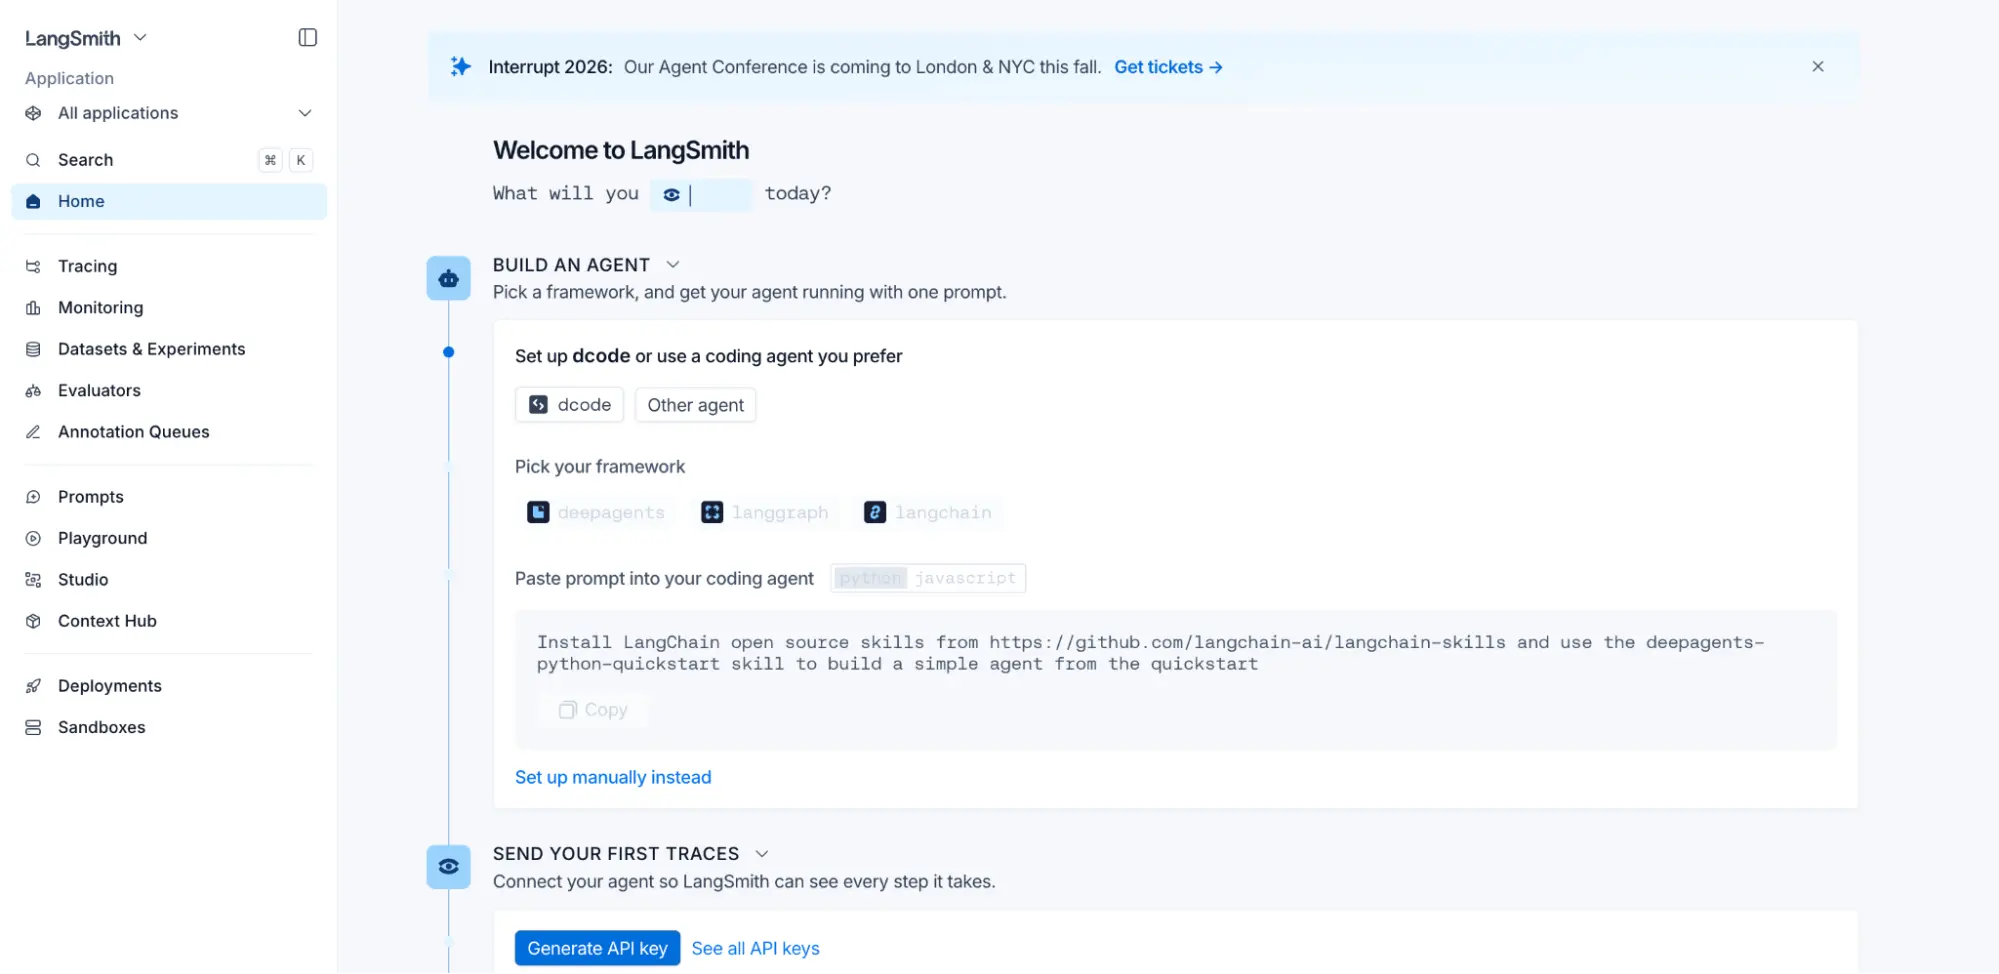
LangSmith is the observability and evaluation platform from the LangChain team. It builds high-fidelity traces that render an agent's full execution tree, tool selections, retrieved documents, and exact parameters at every step.
Its annotation queues are a genuine strength. Subject matter experts can review, label, and correct specific traces through a structured workflow, and that feedback flows into evaluation datasets.
Features
- Full-stack tracing that captures an agent's complete execution tree
- Annotation queues for structured human review of production traces
- LLM-as-judge evaluators for automated scoring of historical runs
- Multi-turn evaluation across full conversation threads
- Prompt management and versioning integrated with evaluation workflows
Cons
- Observability depth drops outside the LangChain ecosystem. It works with any framework via a traceable wrapper, but the deepest integration is LangChain- and LangGraph-specific
- Built-in evaluation metrics are limited; most scoring requires custom implementation rather than a ready-made metric library
- Self-hosting is restricted to the Enterprise tier
- Seat-based pricing can limit access for teams that want product managers or QA in the tool too
Pricing: Free tier available. Plus is $39 per seat monthly, with custom Enterprise pricing above that.
D. Datadog LLM Observability
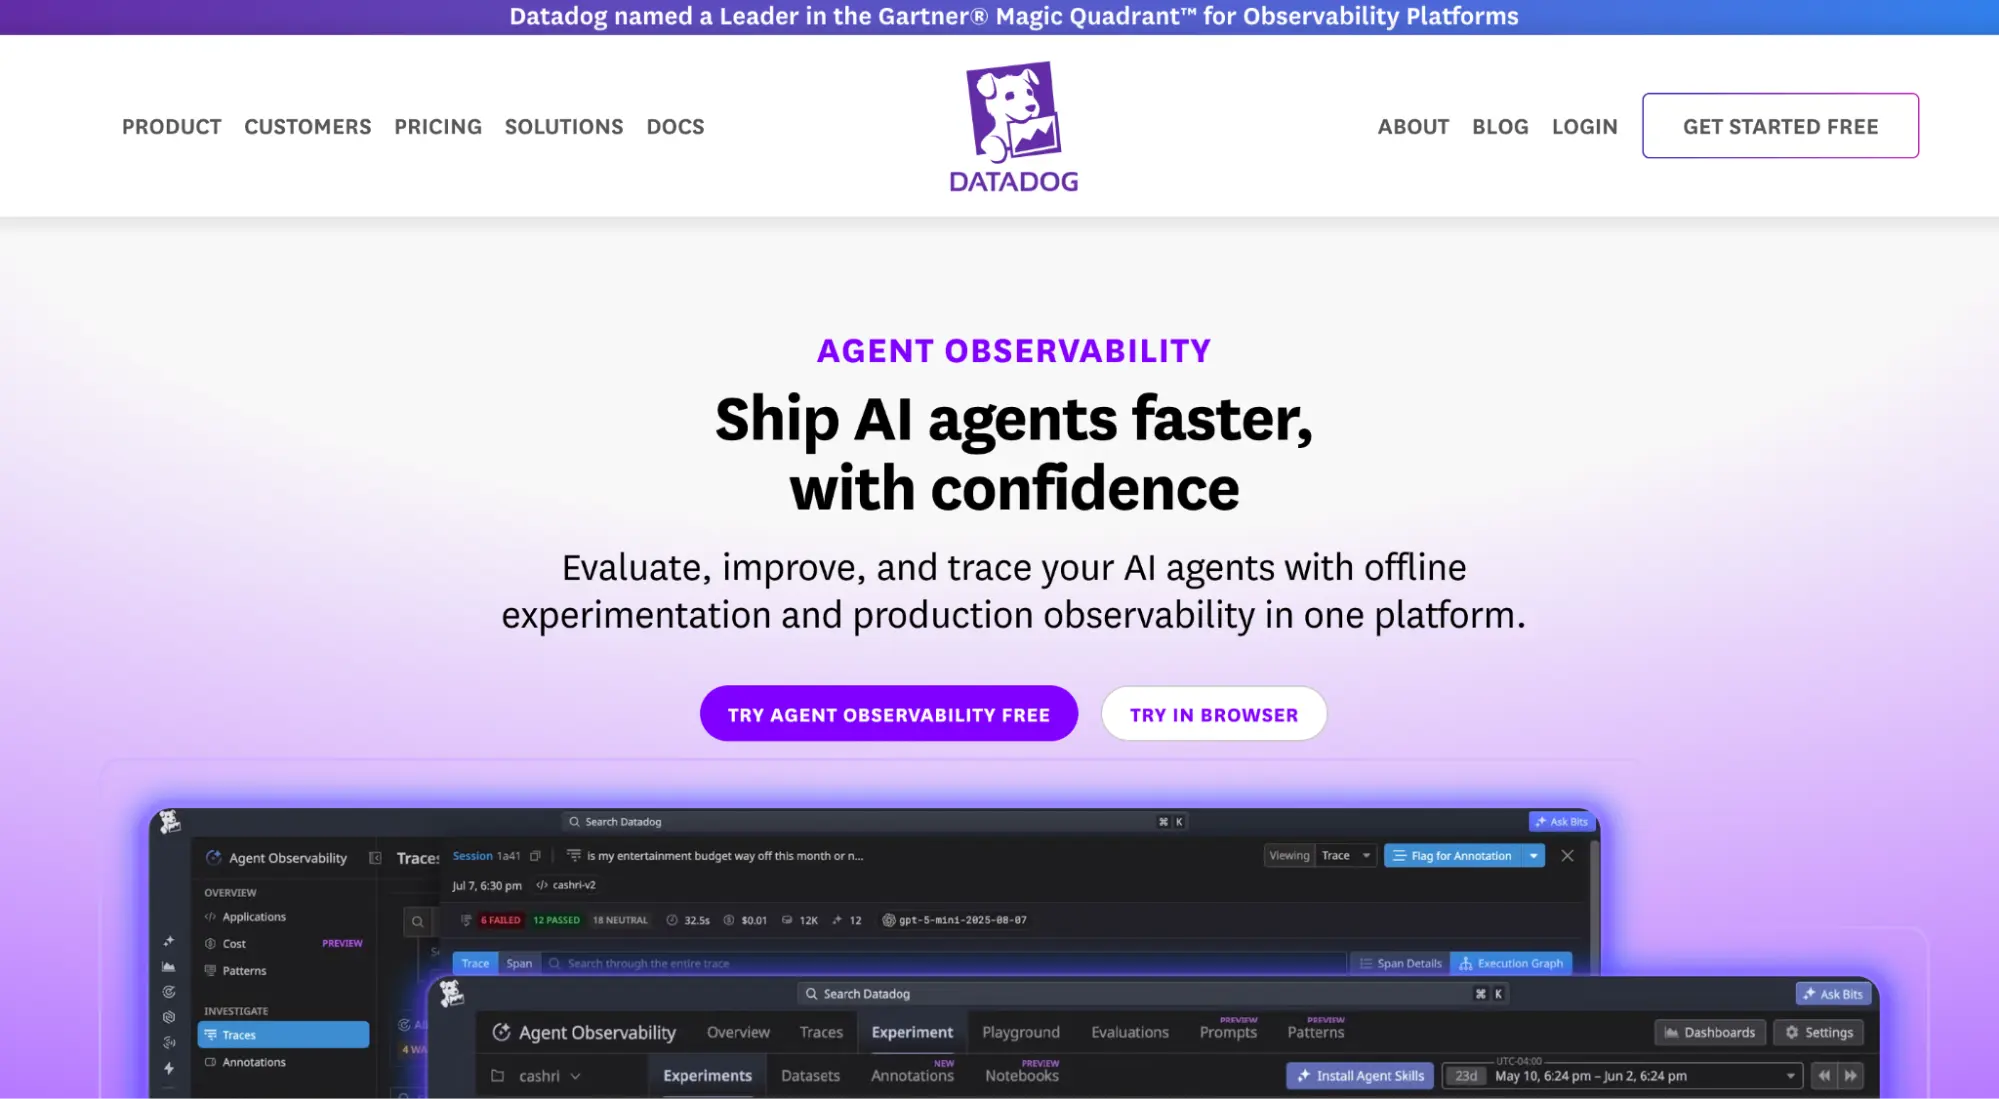
Datadog extends its existing APM platform to cover LLM applications, correlating LLM spans with standard application traces so you can see how model latency affects overall performance. For teams already running Datadog, that means zero new vendor procurement.
It supports agentless deployment through environment variables, which works well for serverless environments, and LangChain applications get automatic instrumentation.
Features
- Correlation between LLM spans and standard APM traces for end-to-end latency analysis
- Agentless deployment mode for serverless and restricted environments
- Unified dashboards showing LLM performance next to infrastructure metrics
- Automatic instrumentation of LangChain applications
Cons
- No built-in evaluation metrics for output quality. It tracks latency, tokens, and errors, not whether the output was actually faithful, relevant, or safe
- Alerting is built for infrastructure failures, not quality degradation, so a hallucinating model that responds in 50ms won't trip any alert
- Pricing scales with request volume and can get expensive at scale
- It's built for SREs and infrastructure teams first, AI quality teams second
Pricing: Published rates start around $8 per 10,000 monitored LLM requests monthly on annual billing, with a 100,000 request minimum. Contact Datadog sales for exact numbers at your volume.
E. Helicone
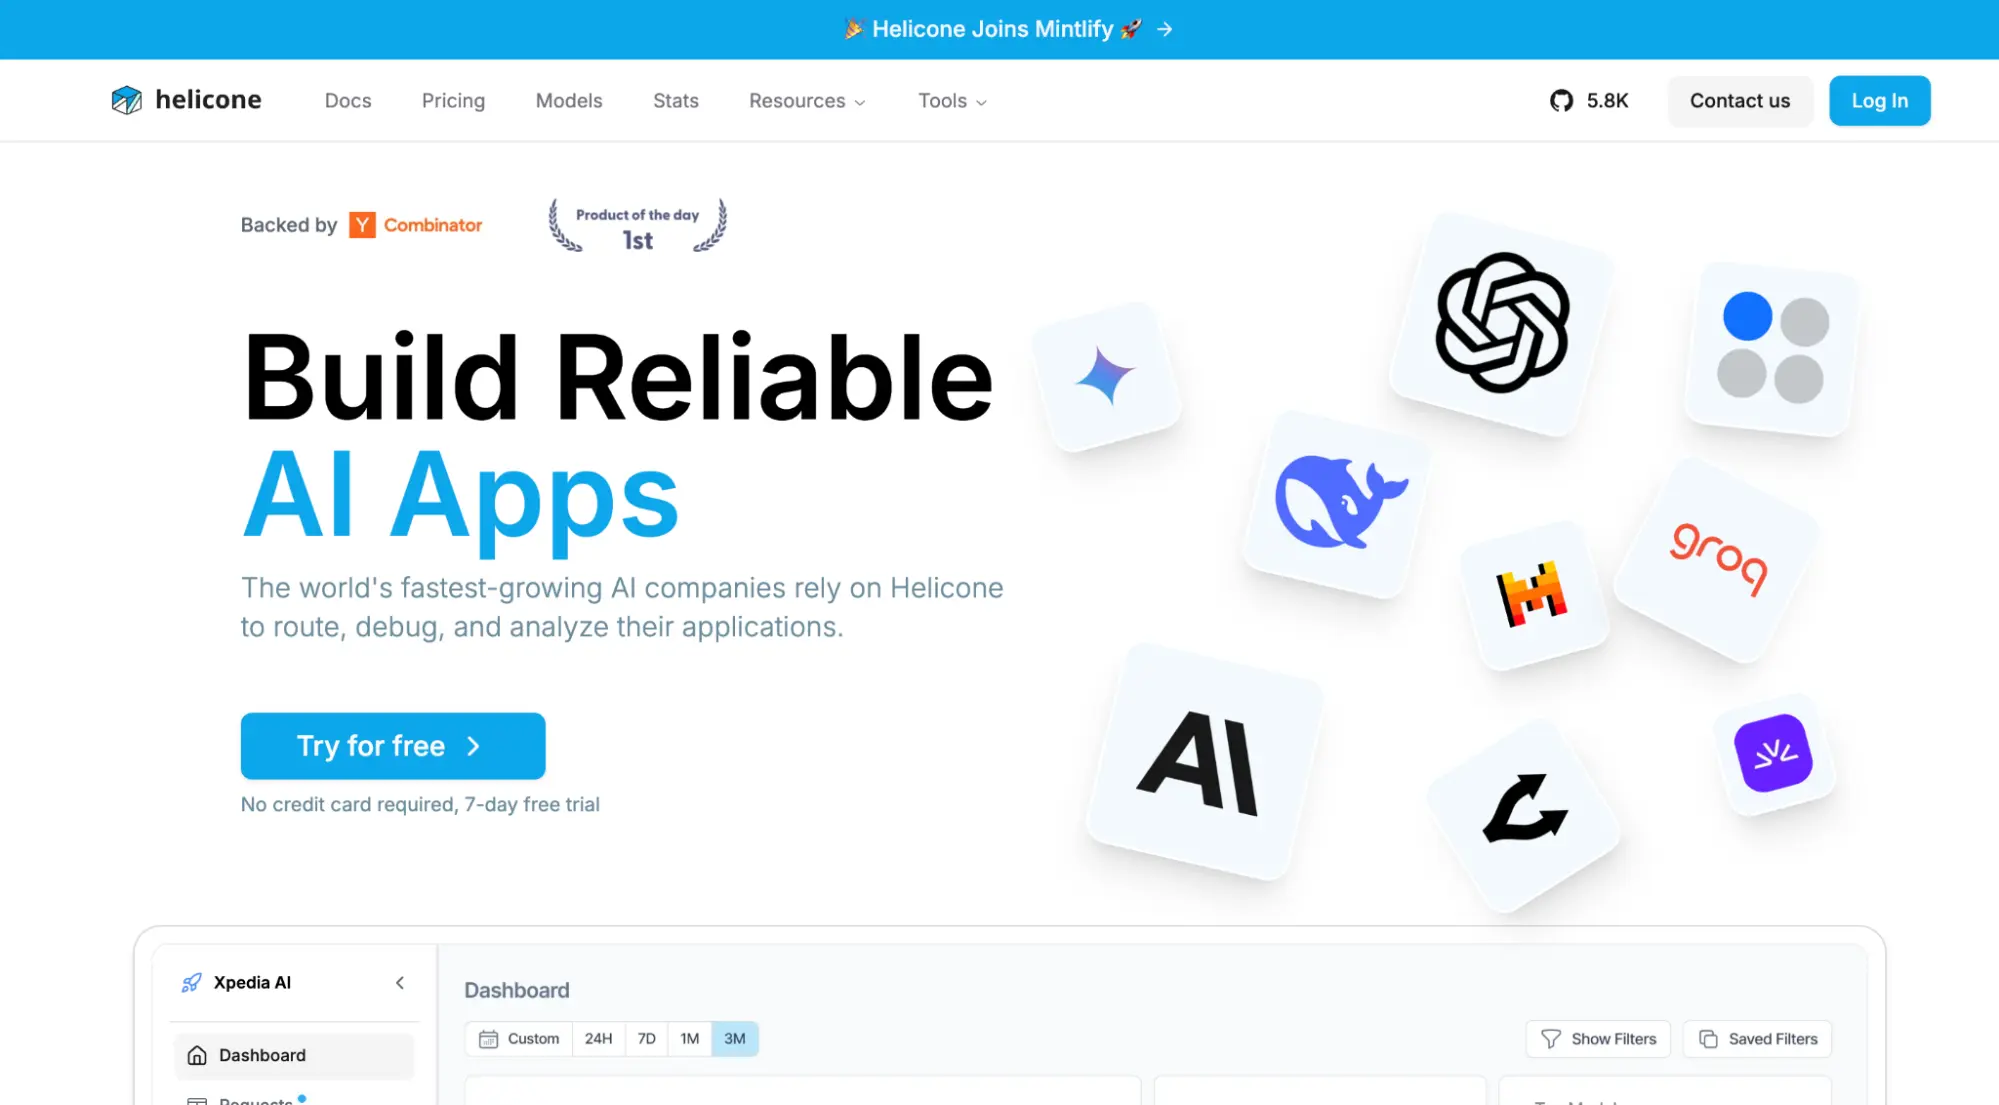
Helicone takes a proxy-based approach. Swap your API's base URL, and you get observability, caching, and cost tracking with minimal code changes, at negligible added latency.
The gateway supports 300+ models across OpenAI, Azure OpenAI, Anthropic, AWS Bedrock, Gemini, and more, with intelligent caching and automatic failover across providers.
Features
- One-line integration by swapping the API base URL
- Intelligent caching and automatic failover across providers -Support for 300+ models through a unified gateway
- Cost attribution, latency tracking, and budget threshold alerts
Cons
- Monitoring is scoped to the request level. You see individual model calls clearly, but not how outputs flow through a broader multi-step agent chain
- Evaluation features are basic compared to dedicated evaluation platforms
- Missing advanced governance features like granular role-based access and audit trails
- Adding a gateway layer means an extra hop in your infrastructure
Pricing: Free tier covers 10,000 requests a month. Pro is $79 a month, Team runs $799 a month, with custom Enterprise pricing above that.
F. Portkey
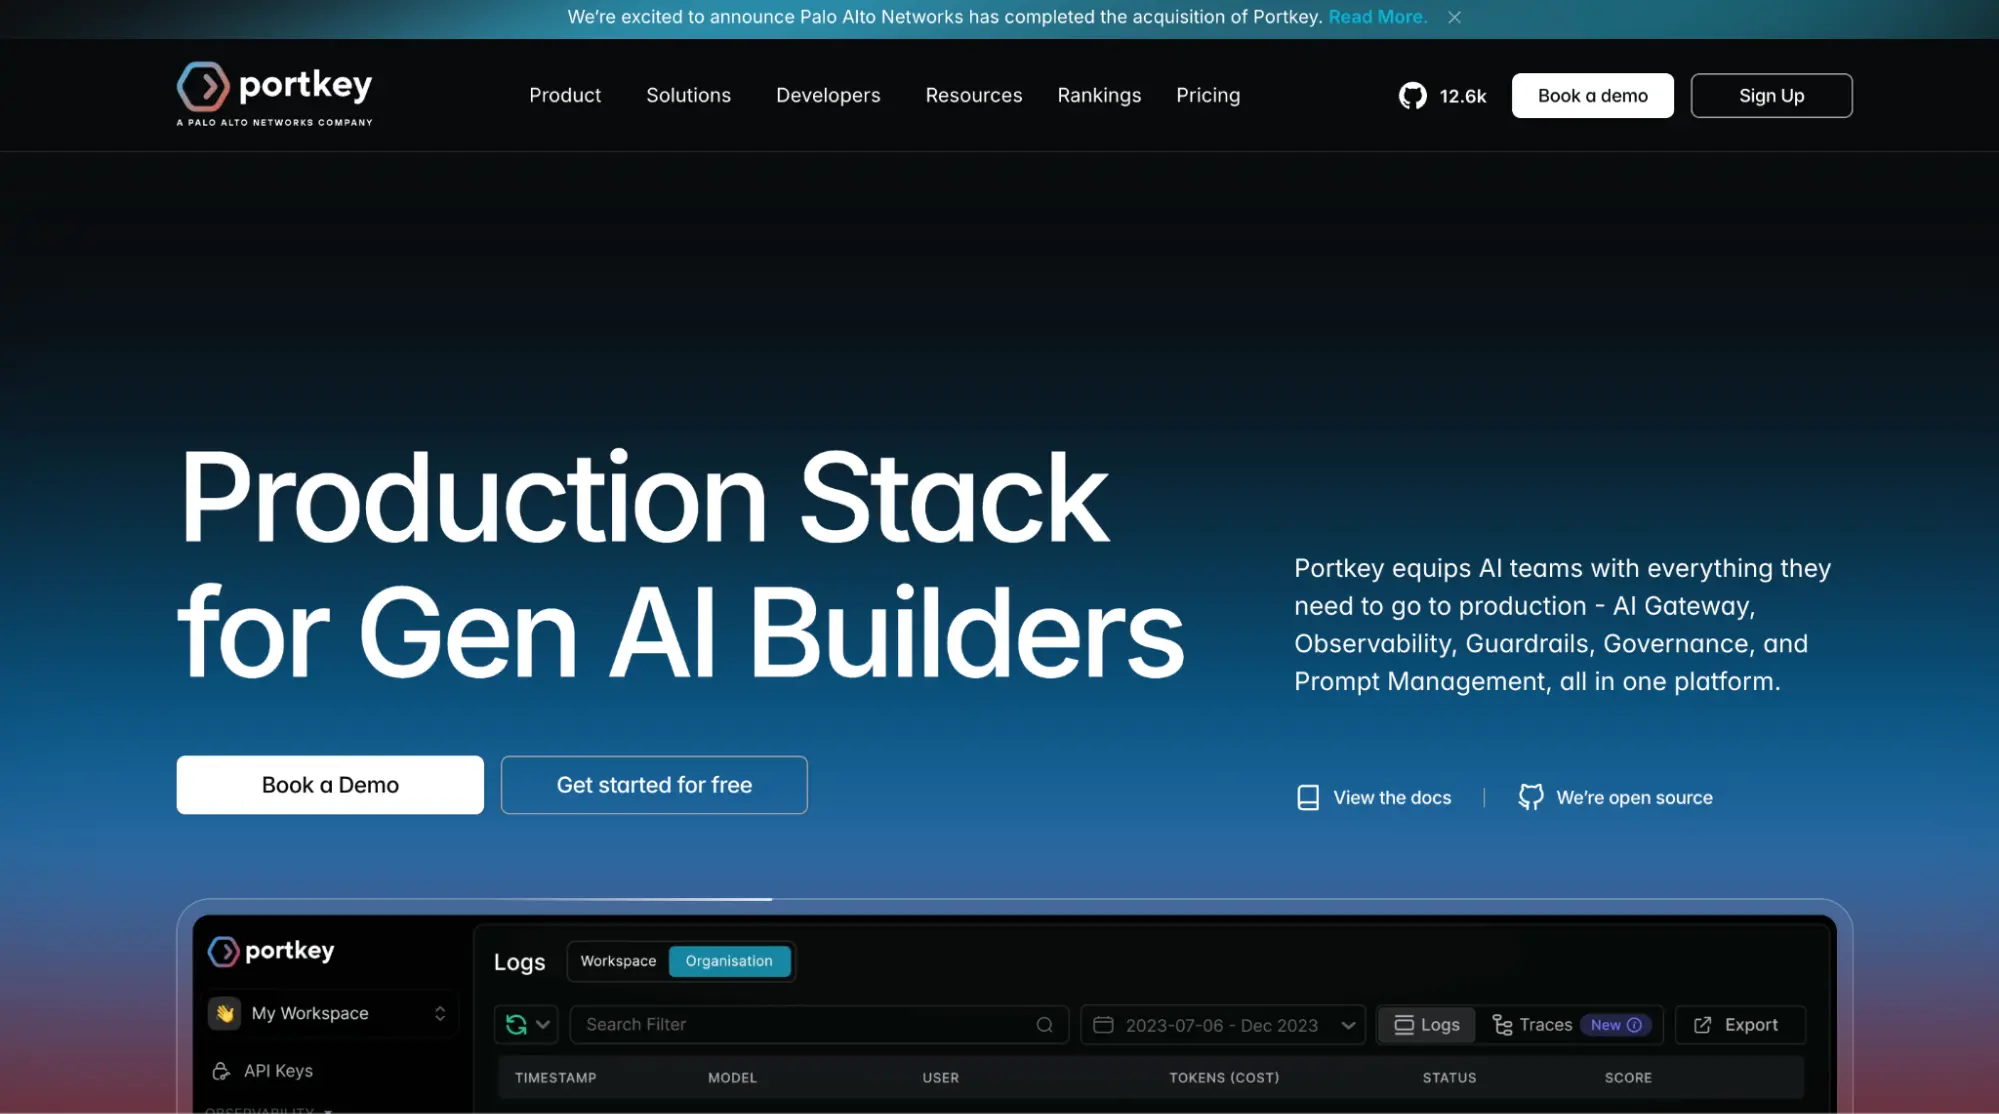
Portkey is primarily an AI gateway. It handles routing, fallbacks, and load balancing with a lightweight footprint that adds sub-millisecond latency overhead, and teams often adopt it to replace custom failover and retry code.
Observability comes along as a built-in feature of the gateway rather than the main event.
Features
- High-performance gateway with sub-millisecond latency overhead
- Automatic failovers, custom routing, retries, and load balancing
- Unified SDKs for JavaScript and Python across multiple providers
- Request-level logging with cost and performance tracking
Cons
- Observability is secondary to gateway functionality, so the depth is thinner than tools built around observability first
- No evaluation metrics for output quality
- No quality-aware alerting or drift detection
- Pricing gets less clear once you move into high-volume enterprise use
Pricing: Free tier includes 10,000 logs a month. Production is $49 a month, with custom Enterprise pricing above that.
G. Arize Phoenix
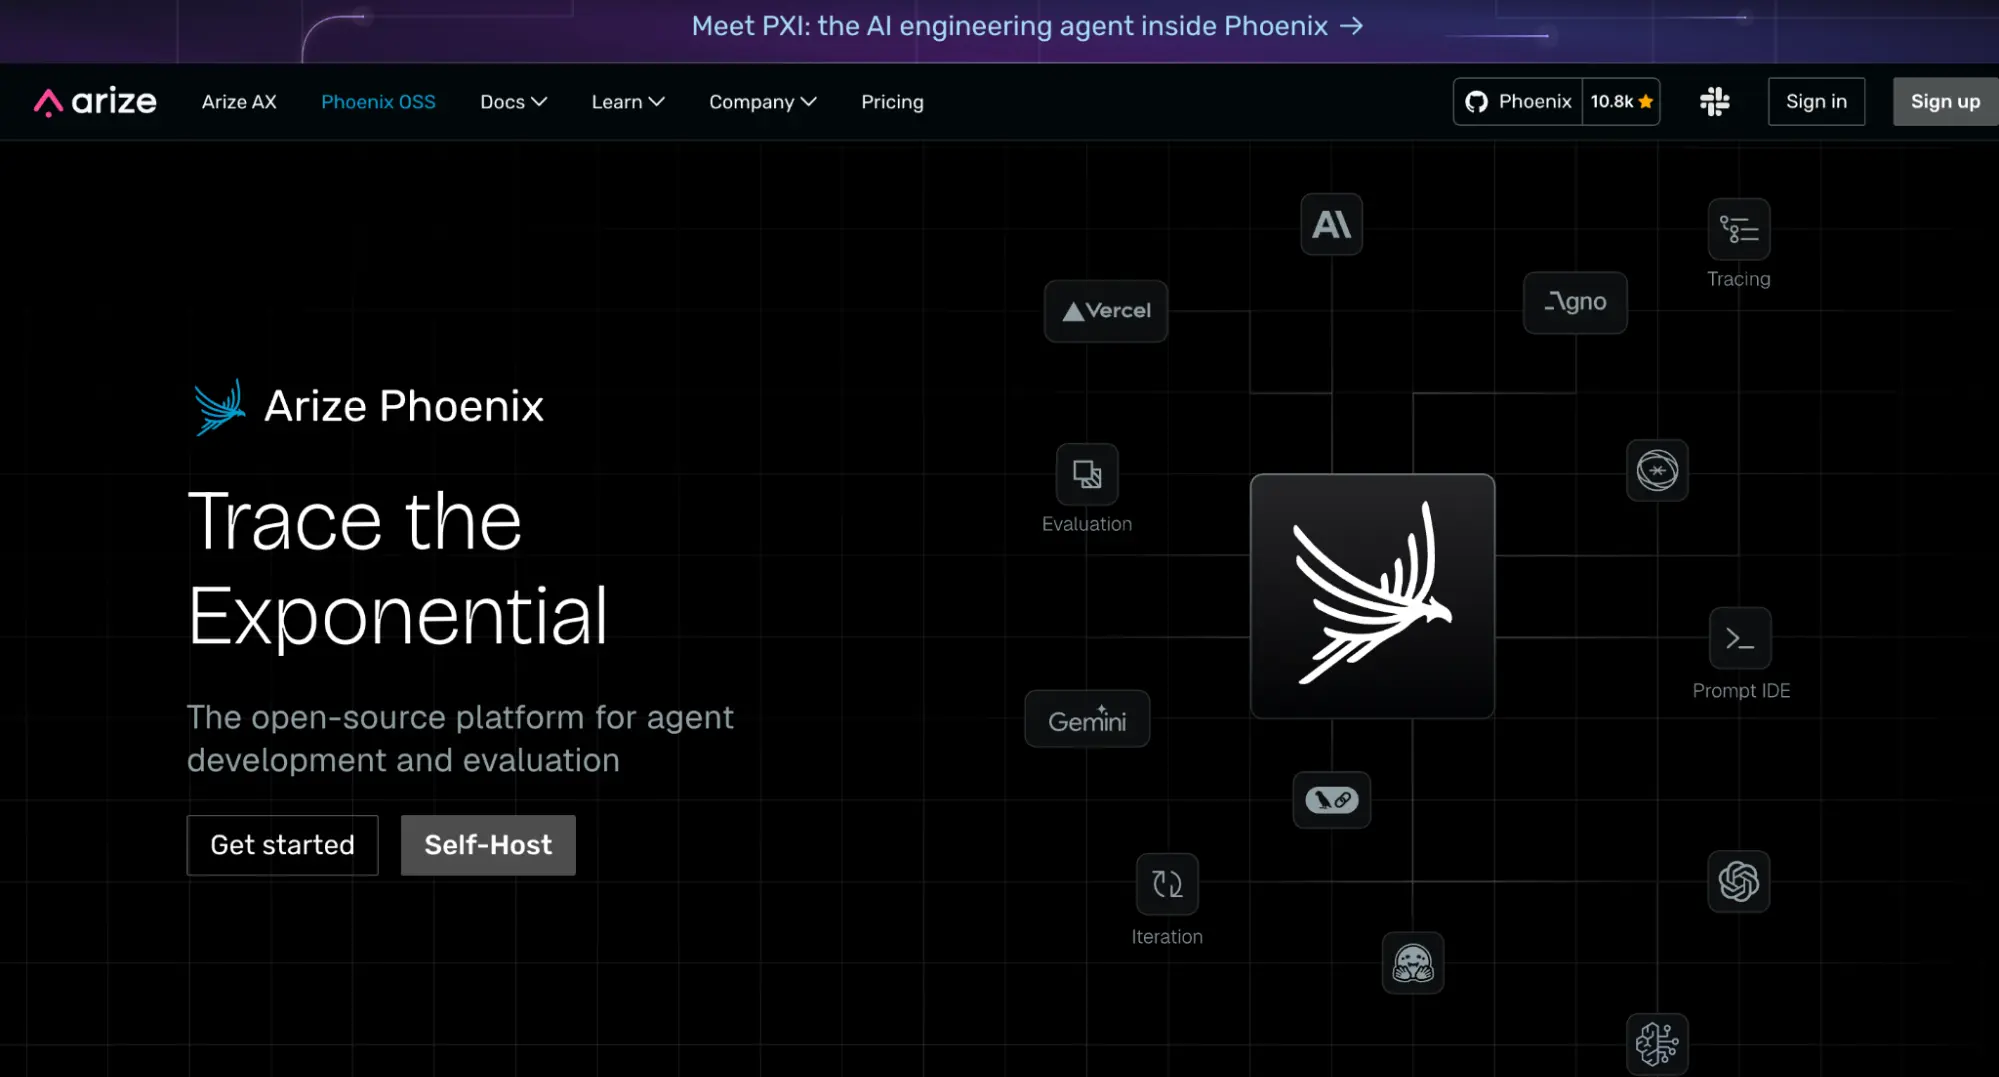
Arize extends its ML monitoring background into LLM observability. Phoenix, its open-source library, is local-first and notebook-friendly, running in Jupyter, locally, or via Docker with zero external dependencies.
Phoenix uses OpenInference, an OpenTelemetry-based instrumentation standard, to support LlamaIndex, LangChain, Haystack, DSPy, and smolagents without vendor lock-in.
Features
- Span-level tracing with custom metadata tagging
- Real-time dashboards for latency, error rates, and token consumption
- Visual agent workflow maps for multi-step LLM pipelines
- Fully local deployment with zero external dependencies
Cons
- The LLM evaluation layer is shallow, since Phoenix was built for ML monitoring first and extended to LLMs after
- The interface is built for engineers, which limits involvement from product managers or domain experts
- Advanced capabilities sit behind commercial tiers with only 14 days of trace retention
- Cost tracking focuses on token counts rather than dollar amounts
Pricing: Phoenix, the open-source core, is free. Arize's managed AX cloud starts around $50 a month, with custom Enterprise pricing above that.
H. Confident AI
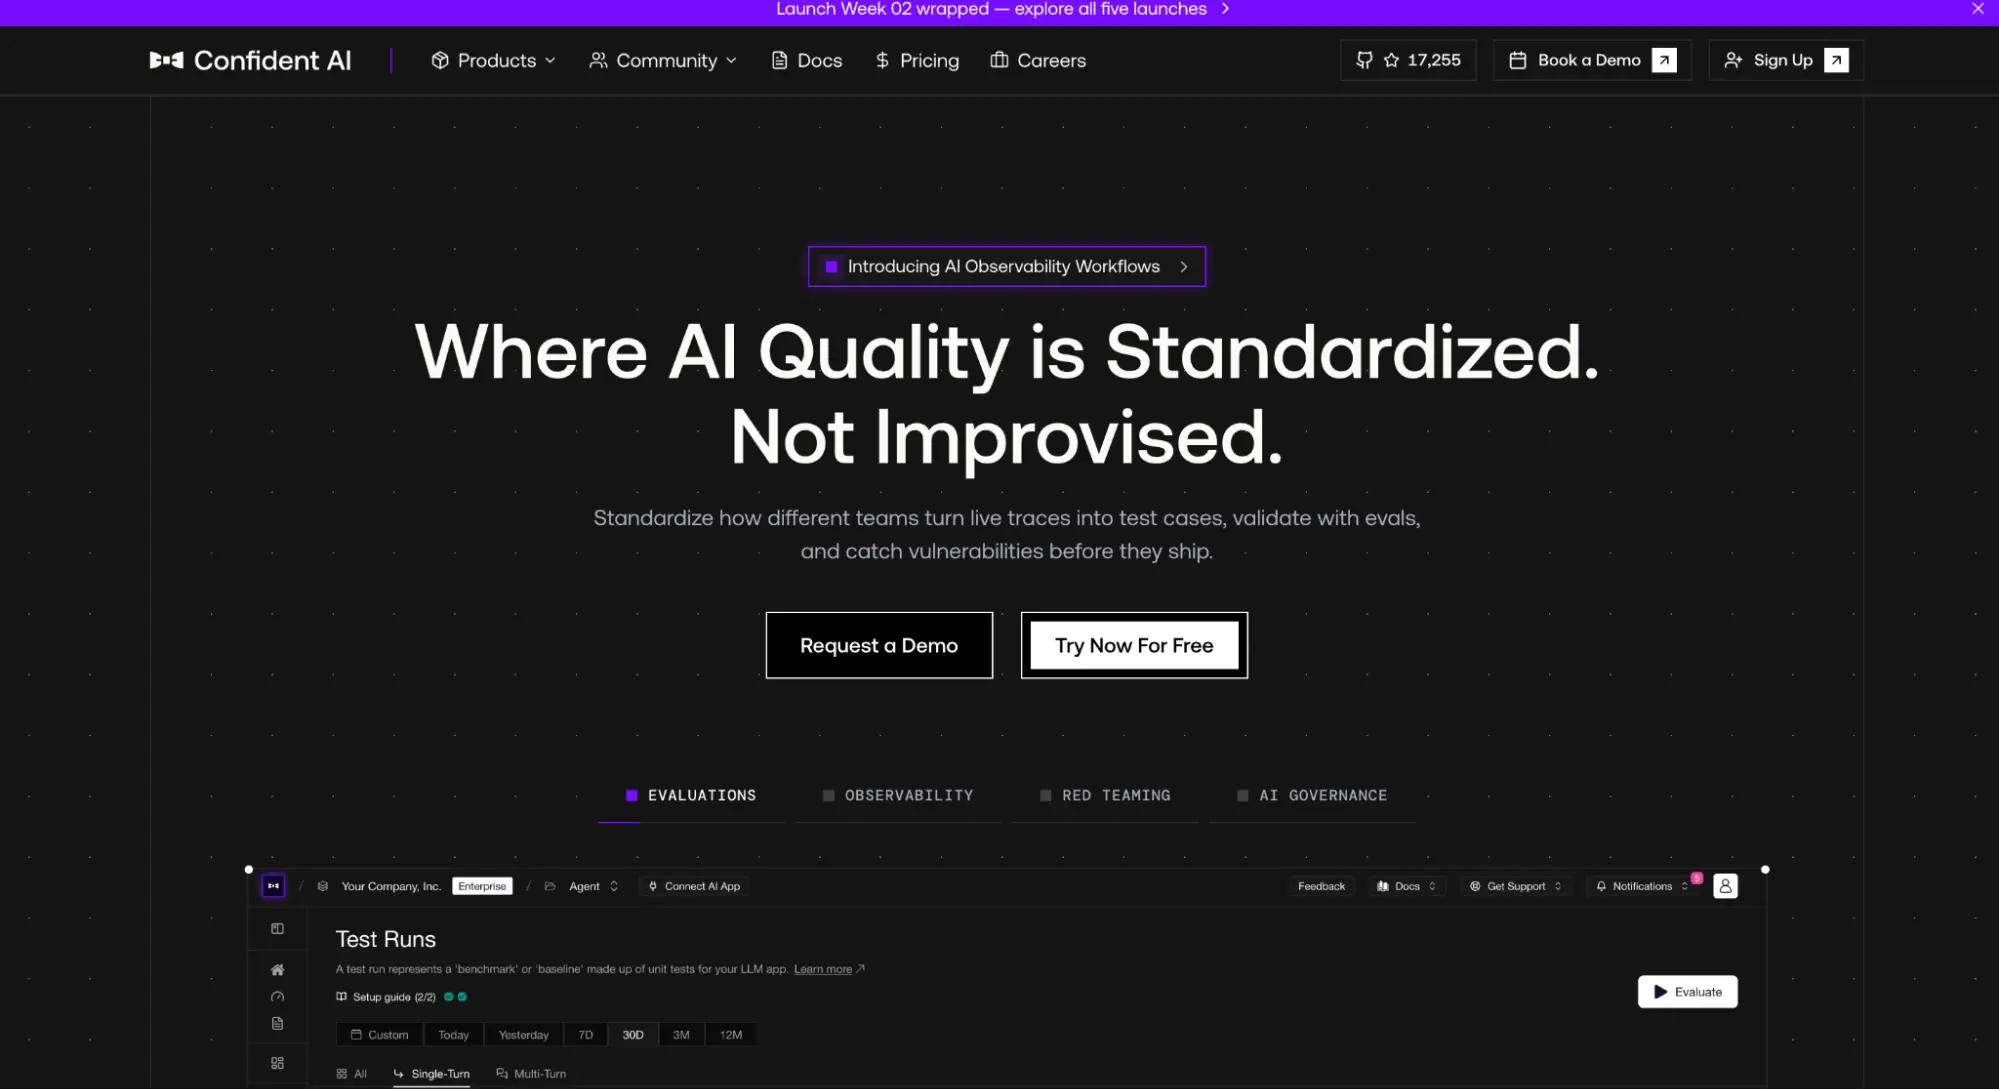
Confident AI is built around evaluation first. Every trace, span, and conversation thread gets scored automatically with a large library of research-backed metrics, rather than just logged.
Quality-aware alerting fires through PagerDuty, Slack, or Teams when scores drop below a threshold, and production traces get curated into evaluation datasets automatically.
Features
- Automated scoring on every trace for faithfulness, relevance, hallucination, bias, and toxicity
- Quality-aware alerting through PagerDuty, Slack, or Teams
- Prompt and use-case drift detection over time
- Automatic dataset curation from production traces
- Cross-functional annotation for PMs, QA, and domain experts, not just engineers
Cons
- Cloud-based, not fully open source, though enterprise self-hosting is available
- The platform's breadth may be more than a team needs if all they want is lightweight tracing
- Teams new to evaluation-first tooling may need time to forecast usage-based, GB-metered costs
Pricing: Free tier available. Starter is $9.99 per seat monthly, with custom Team and Enterprise pricing above that.
4. Which One Actually Fits Your Situation
If your LLM call lives inside a larger workflow, retries, branching, a human approval step, calling three other services, Unmeshed is built for exactly that shape of problem, giving you one execution graph instead of a tracing tool bolted onto application code.
If you need to know whether your model's output is actually good, not just that a call completed, Confident AI or Langfuse are the stronger fit, with Confident AI covering more of the evaluation and alerting out of the box.
If your stack is already LangChain end-to-end, LangSmith gives you the tightest native integration. If you're already running Datadog for infrastructure, adding LLM Observability is the path of least resistance, though it won't tell you anything about output quality.
If you need a gateway for routing, failover, and caching first, Helicone or Portkey solve that directly, with observability along for the ride.
Frequently Asked Questions
Sources
Still debugging across four different logs?
Your LLM call is one step. Your workflow deserves one view.
One graph. Every step visible, LLM calls included.