The one thing that genuinely fills my brain with dopamine is watching Sherlock Holmes walk into a room and immediately know exactly what happened, who did it, and why, while everyone else is still standing around saying "something seems off."
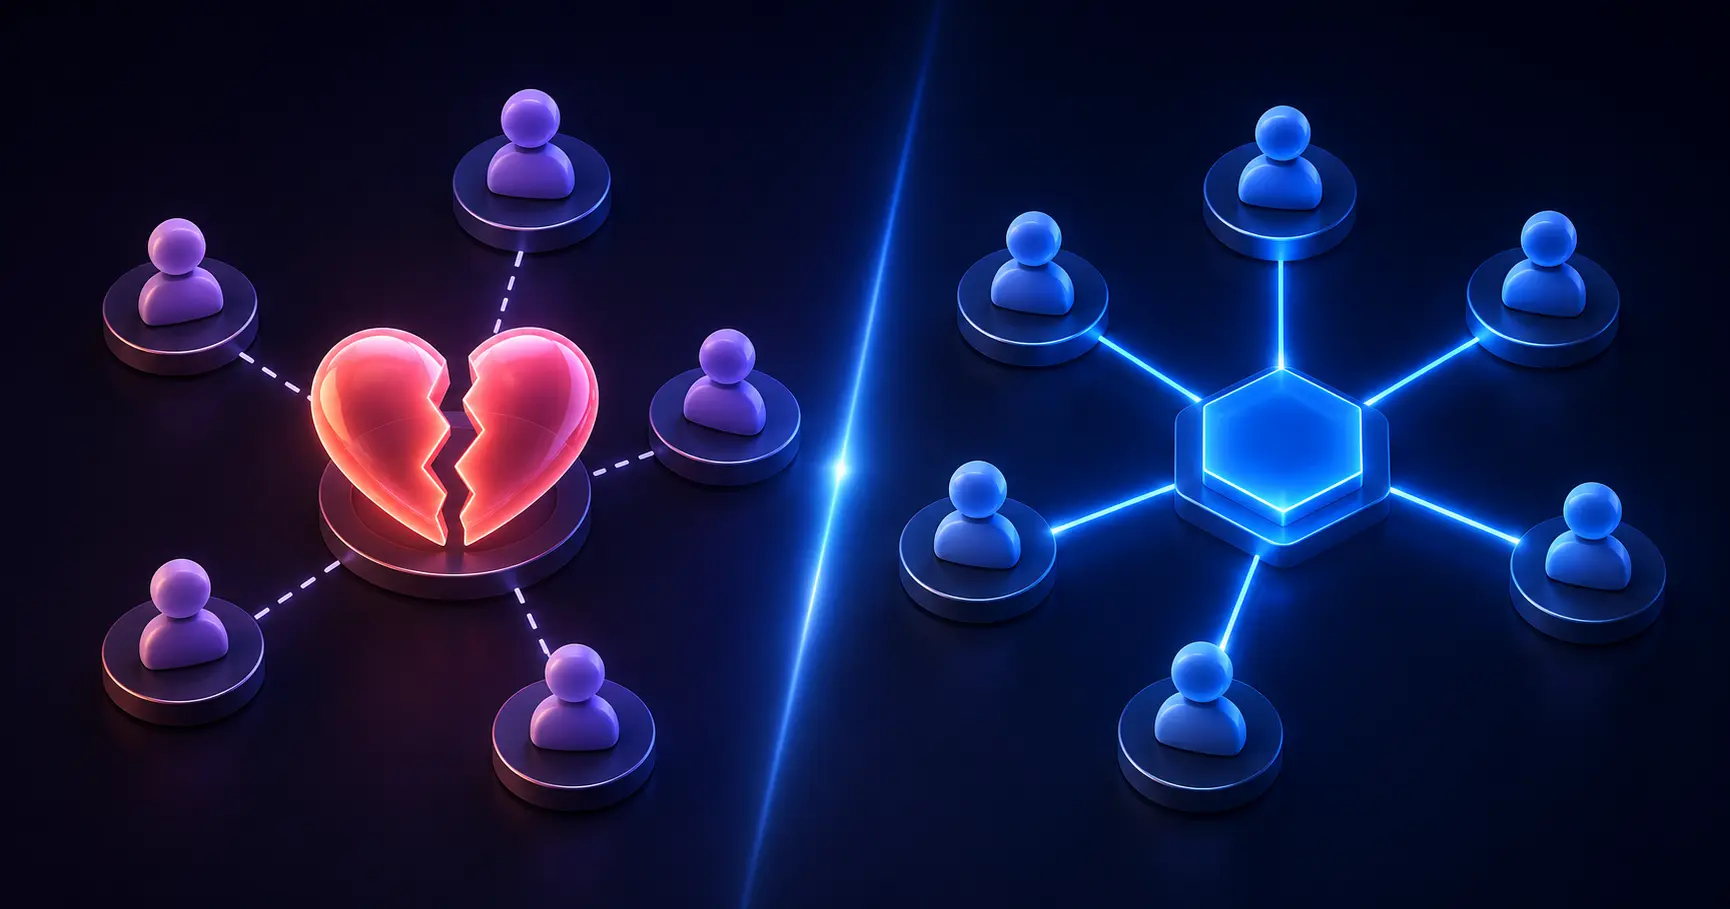
Watson is great. He notices when something is wrong, he raises the alarm, he keeps track of what is happening. But he cannot tell you why. Holmes can. Same room, same evidence, completely different depth of understanding.
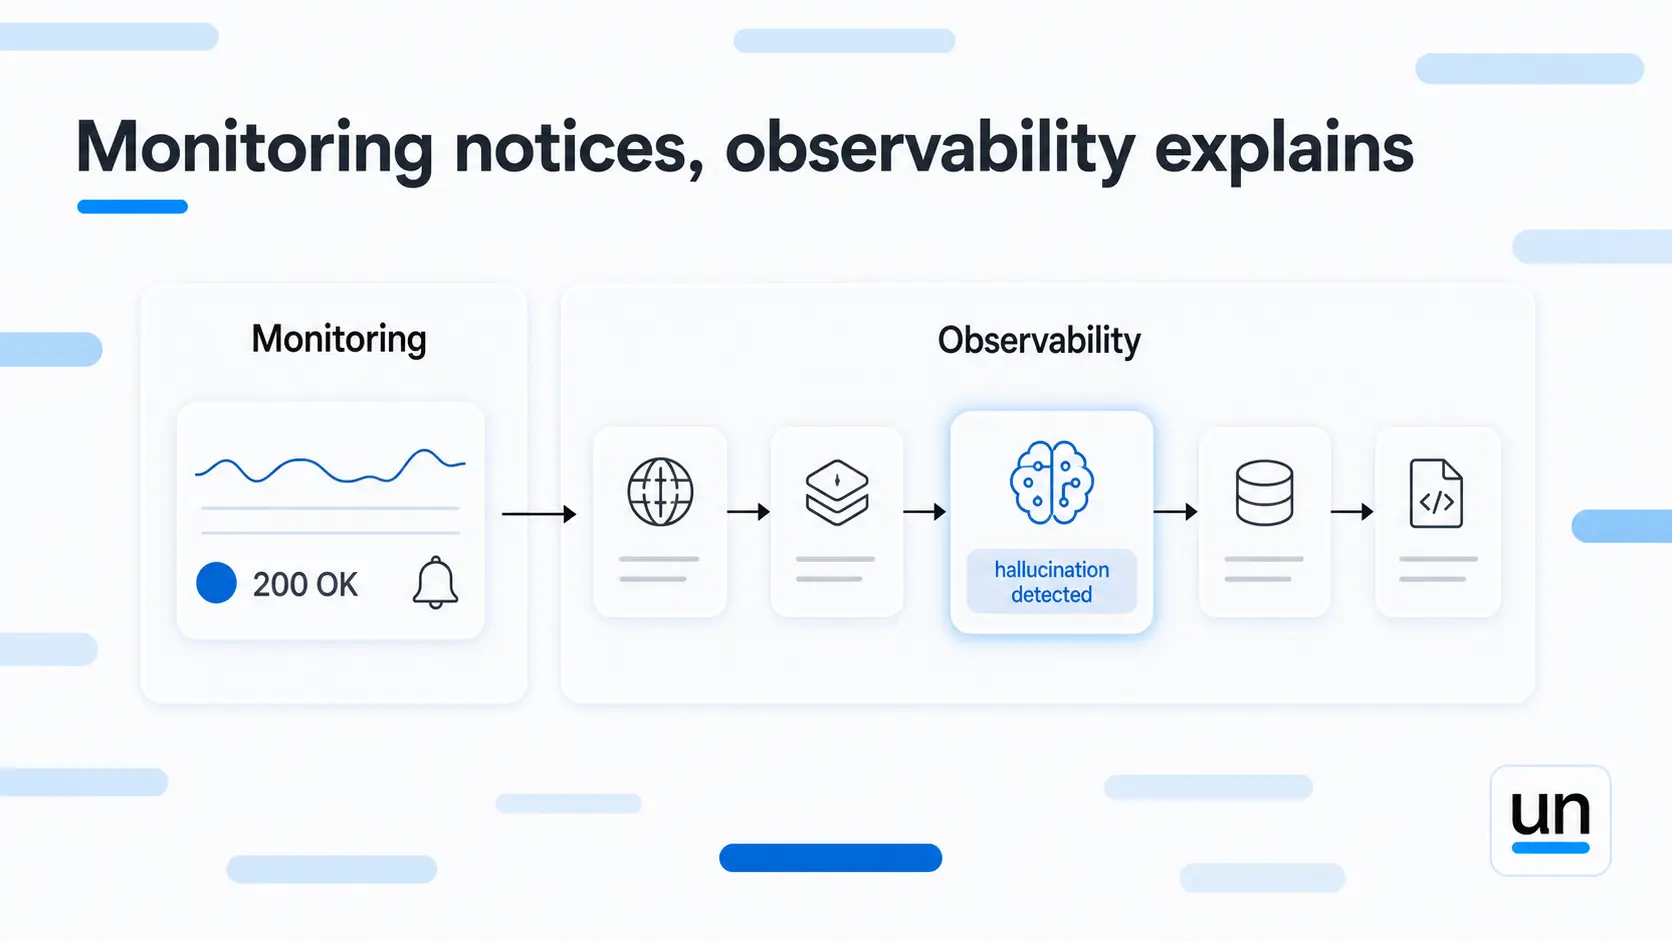
That is exactly the difference between LLM monitoring and LLM observability. Monitoring is Watson; it tells you something broke, latency spiked, error rates climbed, costs jumped. Observability is Holmes; it shows you which step failed, what prompt it received, what the model returned, and where in the pipeline things went sideways.
This post breaks down what each one covers, what to track, and when you need both.
1. What Is LLM Monitoring?
LLM monitoring is the practice of continuously tracking predefined metrics to tell you whether your AI system is healthy at a given point in time. It watches from the outside and tells you when something crosses a threshold you set.
The metrics it typically covers:
- Request latency at p50, p95, and p99
- Error rates and API failures
- Token usage per request
- Cost per call
- Throughput and availability
It is continuous, real-time, and threshold-based. When latency exceeds two seconds, an alert fires. When error rates spike, your pager buzzes. It is how DevOps and platform teams know the system is running.
What it cannot do is tell you why. A hallucinating model returns a 200 OK. Your dashboard stays green. Your user gets a wrong answer. LLM monitoring has no idea anything happened.
"Monitoring is great at telling you a system is down. It is terrible at telling you your AI is confidently wrong."- Chip Huyen, author of AI Engineering
2. What Is LLM Observability?
LLM observability is your ability to see inside a specific request and understand why it produced the output it did. Where LLM monitoring watches the system from outside, observability gets inside each request and reconstructs what actually happened.
Every request generates a trace, and LLM tracing is the mechanism that captures it: a structured record of each step from input to output. In a RAG pipeline, that might be seven steps. In an agent workflow, it could be forty. Observability captures all of it.
What LLM observability actually tracks:
- The exact prompt sent to the model, fully resolved with all context injected
- The model's raw response before your code touched it
- Which documents retrieval returned and their relevance scores
- Latency broken down by individual step
- LLM evaluation scores for quality, relevance, and safety
- Hallucination detection signals
This is where you find out that the retrieval step returned stale documents, or that the prompt doubled in size because a context injection bug ran twice. LLM monitoring would never catch either of those. They both return a clean 200 OK.
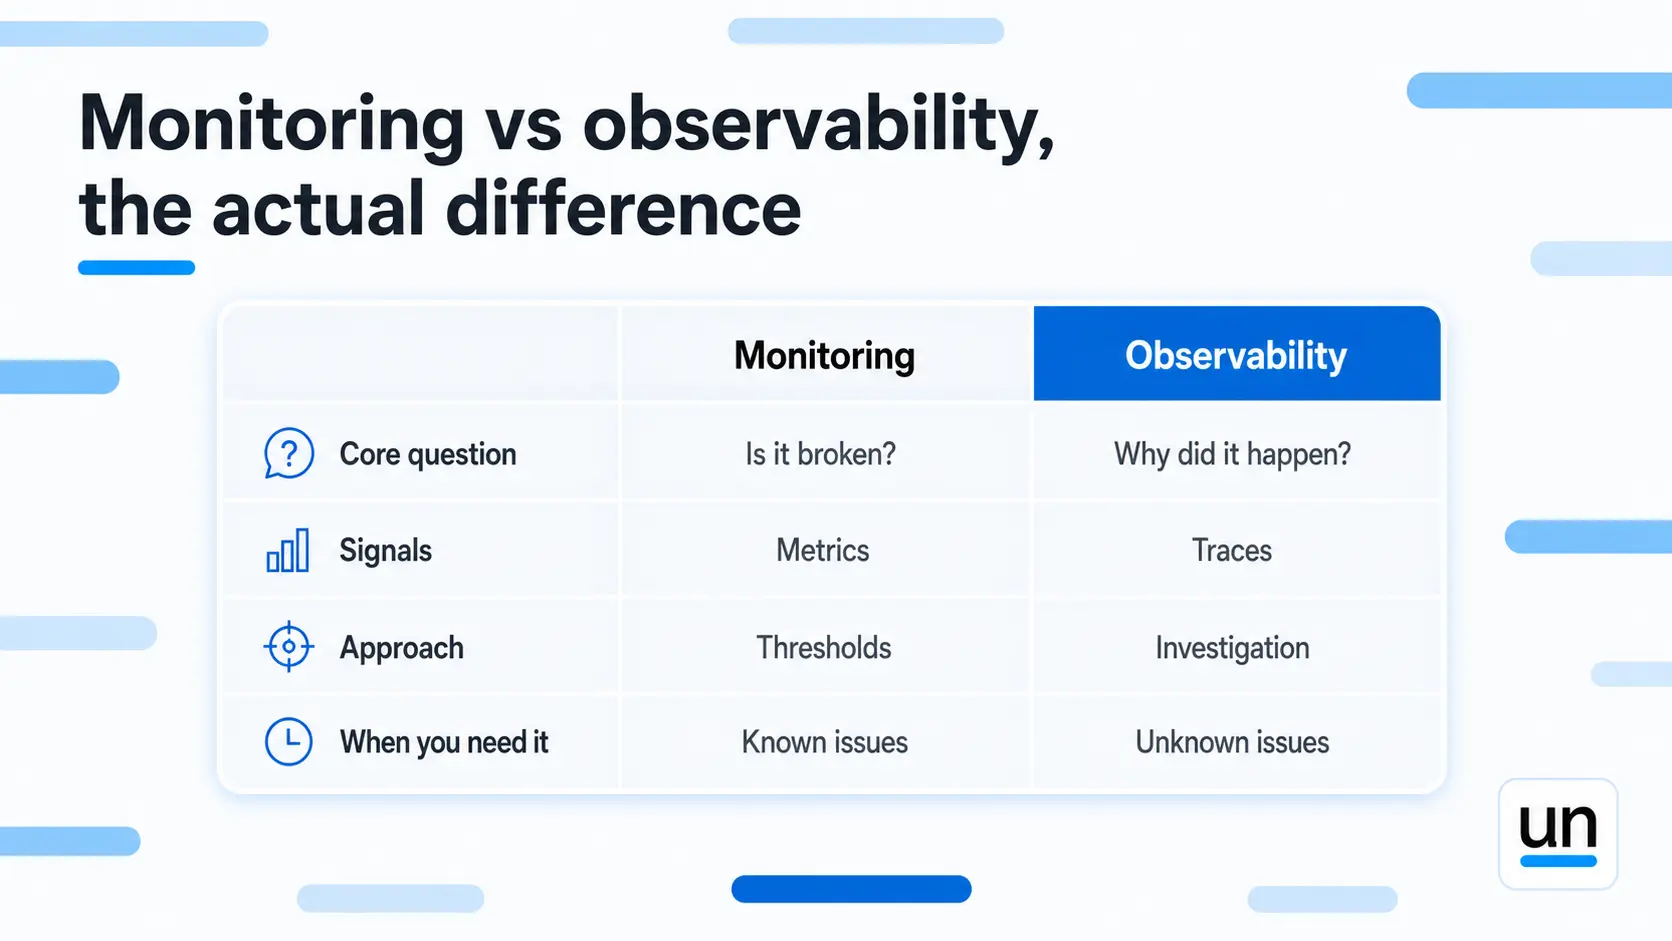
3. LLM Monitoring vs Observability: The Actual Difference
The easiest way to think about it is the question each one answers.
| Dimension | LLM Monitoring | LLM Observability |
|---|---|---|
| Core question | Is it working? | Why did it behave that way? |
| Signals | Latency, error rates, token counts, cost | Traces, prompts, retrieval context, span metadata |
| Approach | Threshold-based alerts | Exploratory, trace-driven investigation |
| Who uses it | DevOps, SREs, platform teams | AI engineers, ML teams, product teams |
| When you need it | Continuous, real-time | Incident investigation, quality debugging |
| Lifecycle | Post-deployment only | Dev through production |
LLM monitoring tells you the alarm went off. LLM observability tells you which wire burned and why.
The gap between these two is where most production AI problems hide. According to Gartner, only 15% of enterprises running generative AI in production have semantic quality monitoring in place alongside operational monitoring. The other 85% are flying half blind.
4. What to Track for LLM Monitoring?
Good monitoring covers three categories. These are the signals that tell you something changed, even if they cannot tell you why.
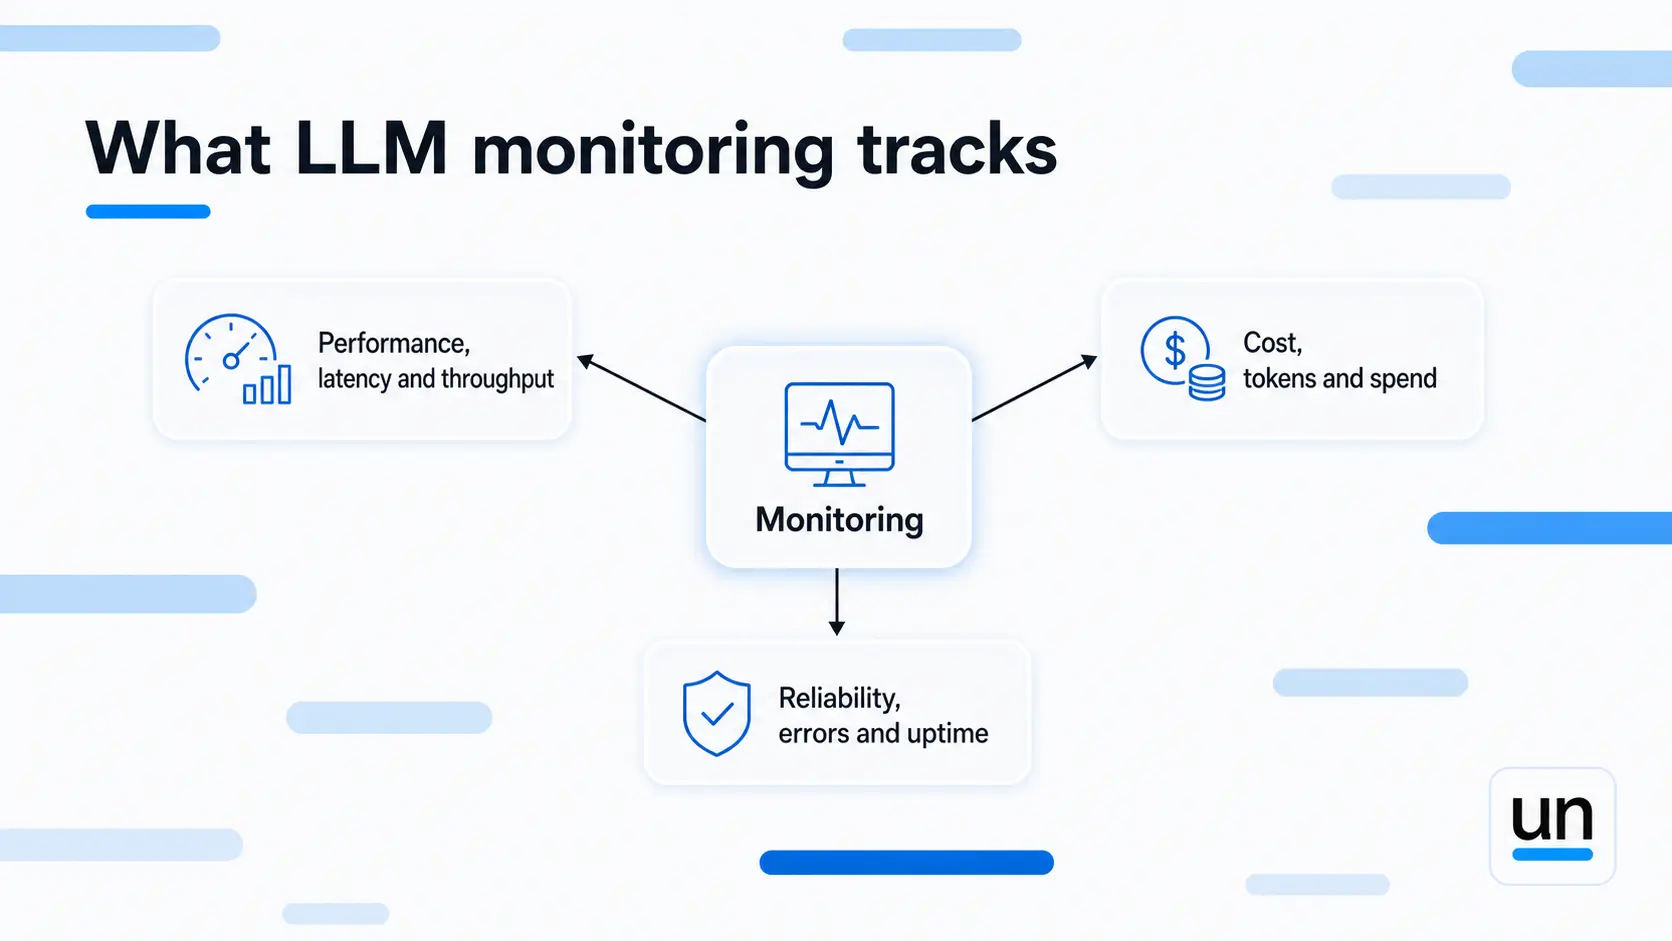
Performance metrics:
- Request latency at multiple percentiles (p50, p95, p99)
- Time to first token for streaming applications
- Token generation rate
- Throughput
Cost and resource metrics:
- Input and output token counts separately (output costs four to five times more)
- Cost per request
- Total spend by model and by workflow
- GPU and CPU utilization
Reliability metrics:
- Error rates by type
- API failure rates per provider
- Availability and uptime
- Rate limit hits
These numbers give you a real-time view of system health. Set alerts on the ones that matter for your SLAs and your budget. If any of them move, monitoring is what catches it first.
5. What to Track for LLM Observability?
LLM observability goes into territory that operational metrics simply cannot reach. These are the signals that tell you whether your AI is actually doing what it is supposed to do.
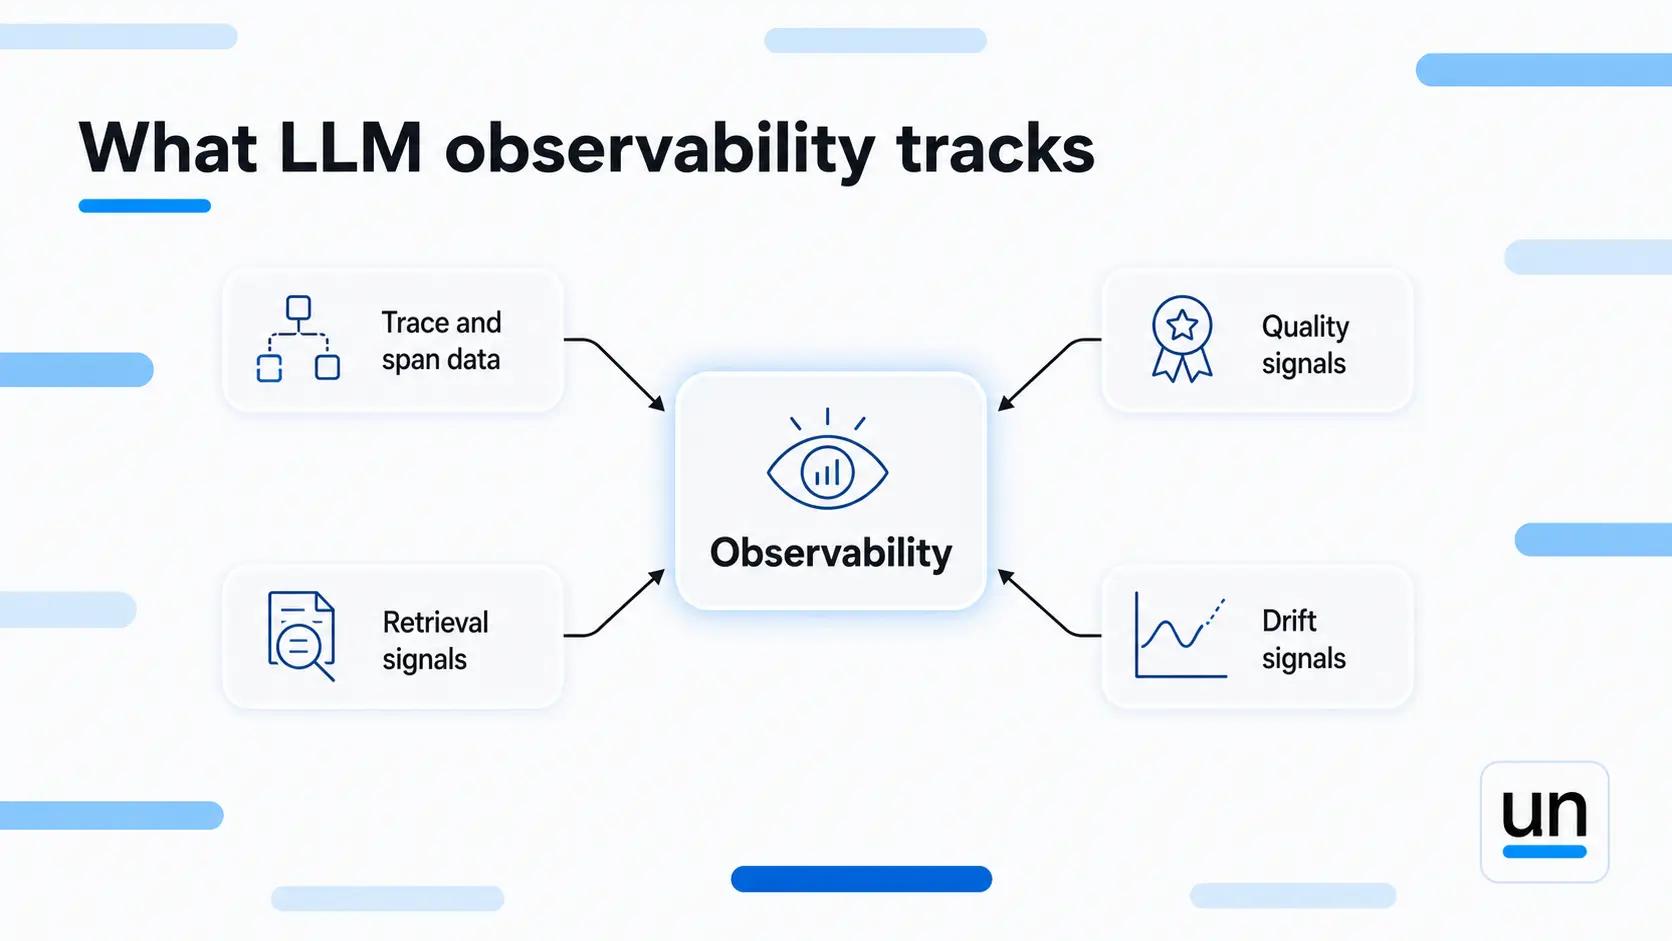
Trace and span data:
- Full request traces with step-level breakdown
- Inputs and outputs at each step
- Prompt versions and model configurations
- Tool calls and their results in agent workflows
Quality signals:
- Hallucination detection rates
- Relevance scores for RAG outputs
- Factual accuracy against ground truth
- Safety and toxicity flags
Retrieval signals (for RAG):
- Documents retrieved and their relevance scores
- Context window utilization
- Retrieval latency by query type
Drift signals:
- Output quality degradation over time
- Semantic drift in responses
- Prompt effectiveness changes
The distinction matters most for agentic systems. According to Databricks, tool-related failures are the most common category of production agent failures, and they are almost entirely invisible to LLM monitoring alone.
6. Which Failure Modes Does Each One Catch?
This is the table worth bookmarking. Different failures require different detection approaches.
| Failure mode | LLM Monitoring catches it? | LLM Observability catches it? |
|---|---|---|
| Latency spikes | Yes | Yes, plus tells you which step |
| Cost overruns | Yes | Yes, plus tells you which prompt caused it |
| Hallucinations | No | Yes |
| Silent quality degradation | No | Yes |
| Wrong retrieval context | No | Yes |
| Prompt regression after update | No | Yes |
| Provider outages | Yes | Partially |
| Agent tool-call loops | Limited | Yes |
Notice how many of the hardest failures, the ones your users will actually complain about, fall entirely in the observability column. LLM monitoring would never catch a hallucination. It would never catch retrieval returning stale documents. It would never catch a prompt regression that degraded quality across ten thousand requests while every operational metric stayed green.
This is the Watson problem. Watson keeps excellent notes. He just cannot solve the case.
7. Do You Need Both?
For simple, single-model applications at low volume, LLM monitoring alone might be enough. If your app sends a request to one provider and returns the result, and quality is easy to verify, start with monitoring and add observability as complexity grows.
For everything else, you need both. That includes:
- RAG pipelines where retrieval quality determines output quality
- Multi-step agent workflows where tool failures compound
- Any application in a regulated industry where audit trails matter
- High-volume production systems where production AI monitoring alone leaves quality gaps
- Teams running multiple models where routing and fallback need visibility
McKinsey found that 88% of organizations use AI in at least one business function but only 1% report mature implementations. A lot of that gap lives in observability. Teams move fast and quality problems surface from user complaints rather than dashboards.
If you want to go deeper on what LLM observability specifically covers, our post on what LLM observability is and why your production AI needs it covers the full picture.
8. How to Start With LLM Monitoring in Production?
The practical rollout most teams follow looks something like this.
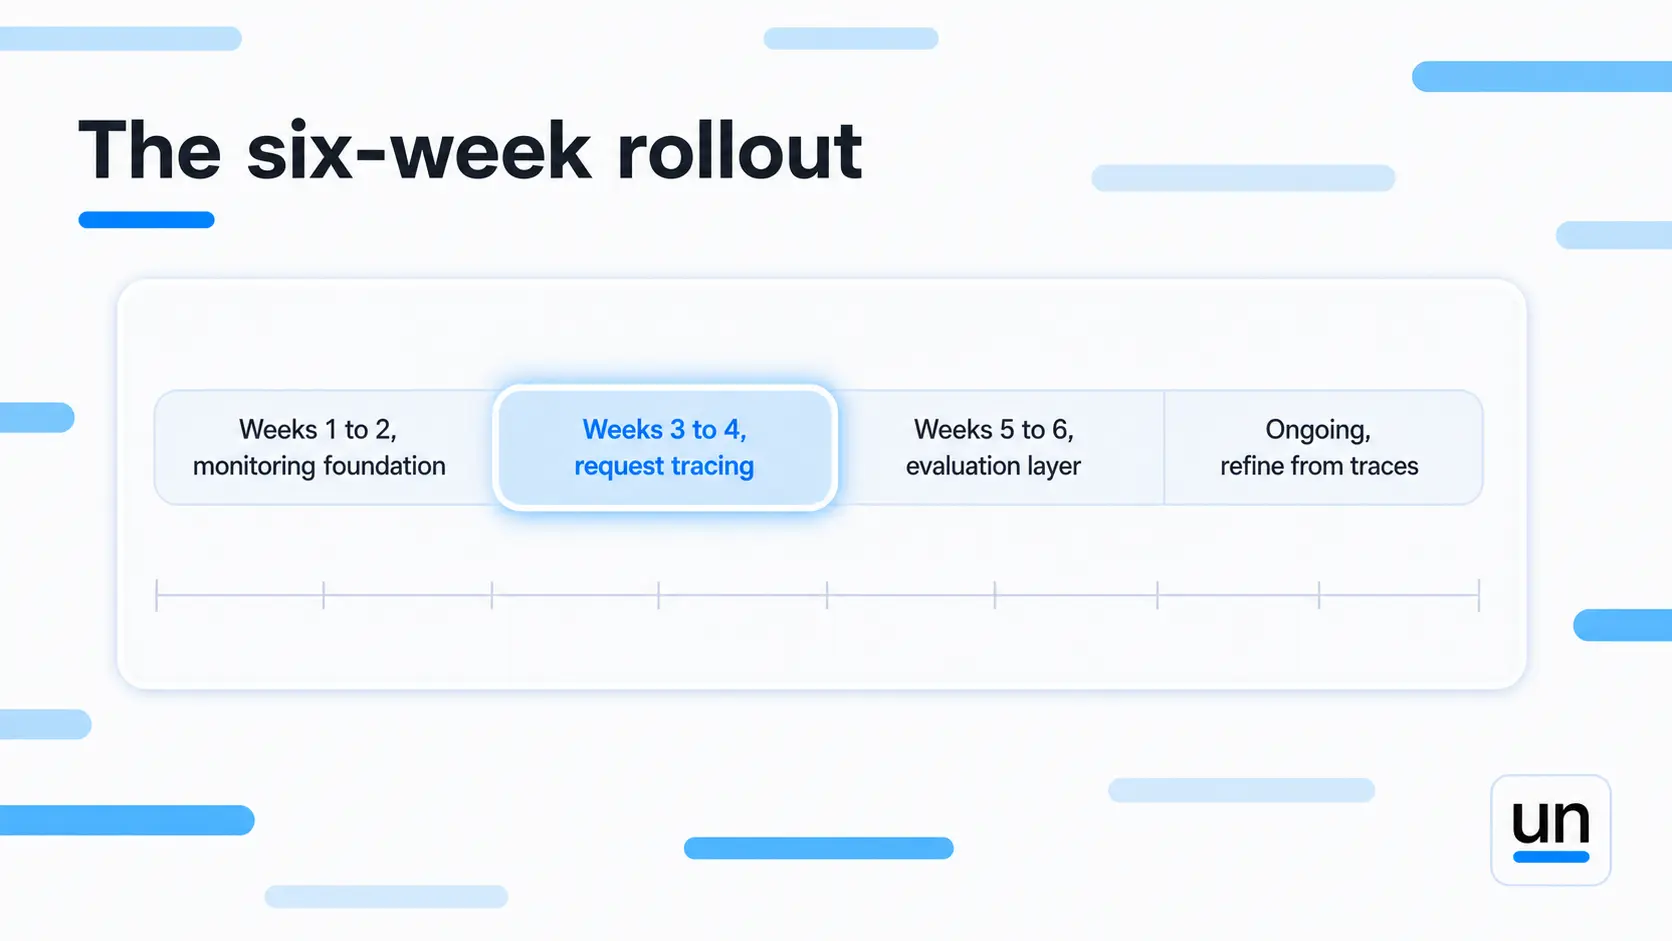
- Weeks one and two: Set up the monitoring foundation. Instrument latency, error rates, token usage, and cost. Get dashboards and basic alerts in place. This is your Watson layer; it notices when something is off.
- Weeks three and four: Add request-level tracing. Capture full traces with span-level detail. Log prompt and response pairs with metadata. Now you have the Holmes layer, the one that can actually investigate.
- Weeks five and six: Layer in evaluation. Run automated quality scoring on production traffic. Set alerts when quality scores drop. This closes the gap between "the system is running" and "the system is working."
- Ongoing: Feed production traces back into your evaluation datasets, refine scoring logic as the application evolves, and improve prompts based on what the traces actually show you.
The temptation is to skip straight to observability tooling before monitoring basics are in place. Do not. Monitoring gives you the baseline for LLM performance tracking that makes observability useful.
9. How Unmeshed Fits Into LLM Monitoring?
Unmeshed is a workflow orchestration platform, not a dedicated observability tool. But if you are running AI workflows in Unmeshed, you already have something most teams set up separately: step-level execution visibility baked into every workflow run.
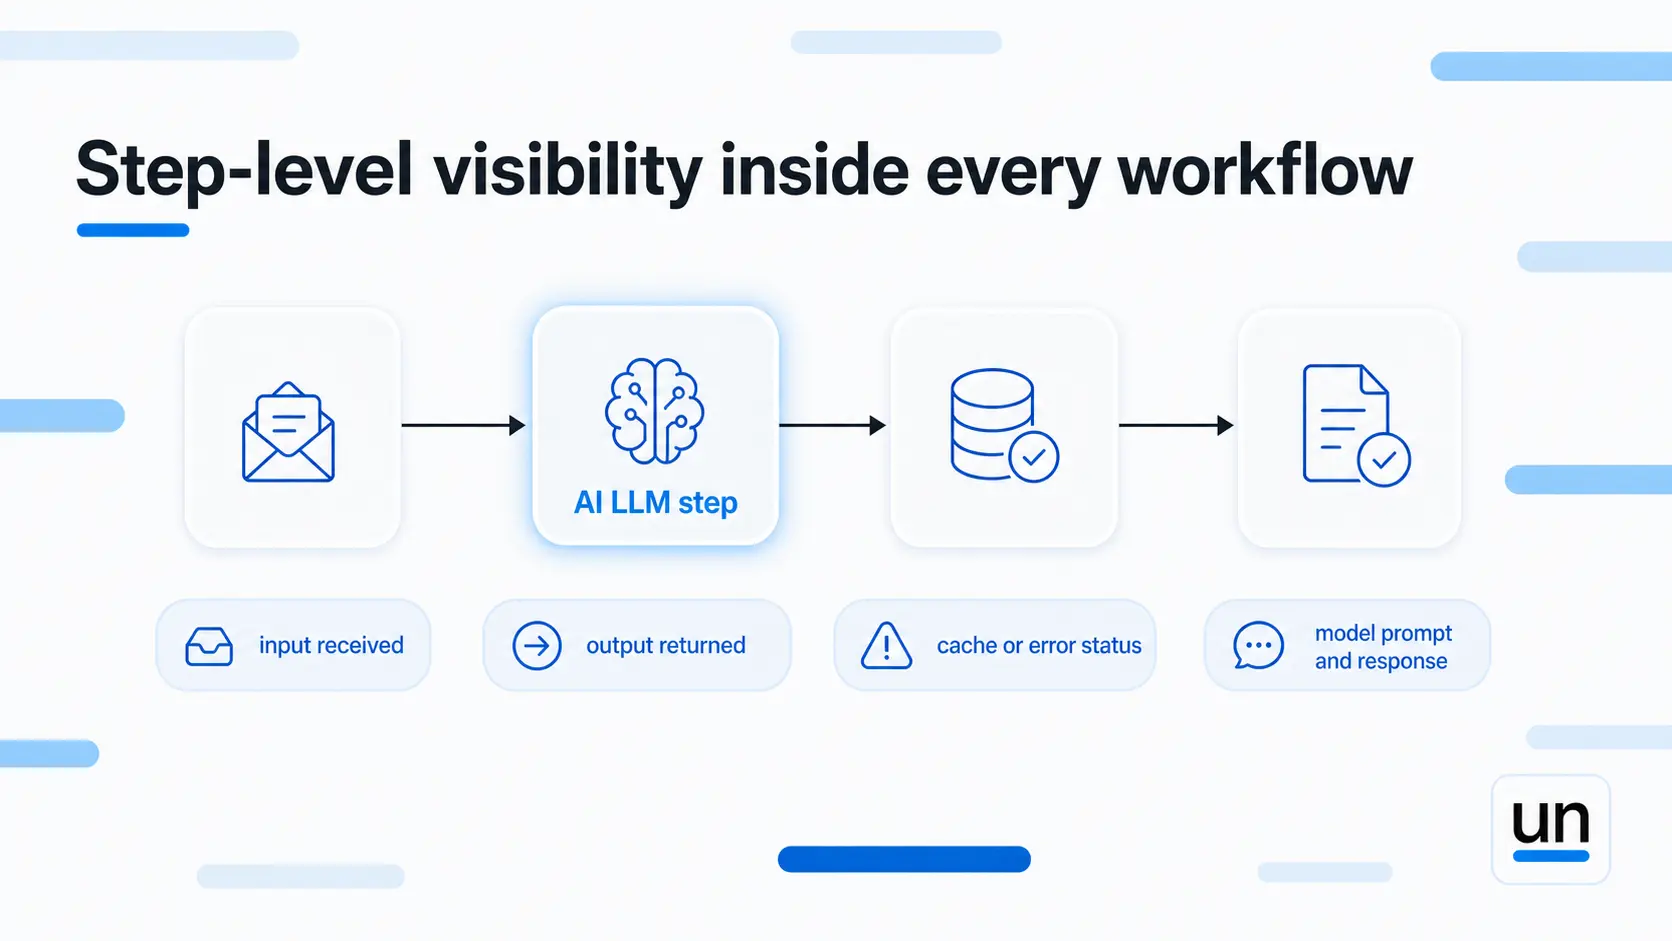
Every step records:
- What it received as input and what it returned
- Whether it hit a cache or triggered an error policy
- What the model was asked and what it returned for AI LLM steps specifically
This is not semantic evaluation or hallucination detection. It is the execution-level foundation that makes LLM monitoring actually useful. You know which step ran, what it received, and where things went sideways before you even open a separate observability tool.
If you want to see what that looks like in a real AI workflow, the Agentic AI page shows how AI steps sit inside production workflows. And if you are ready to build, start free, and your first workflow has step-level visibility from day one.
The Bottom Line
LLM monitoring and LLM observability are not competing approaches. They answer different questions, and they catch different problems.
Monitoring is Watson. It watches the system, notices when something changes, and raises the alarm. You absolutely need it.
Observability is Holmes. It gets inside the request, follows the evidence, and tells you exactly what happened and why. For anything beyond the simplest AI application, you need this too.
Start with monitoring. Add observability as your system gets more complex. And never assume a green dashboard means your AI is producing good answers, because it almost certainly is not telling you either way.
Frequently Asked Questions
Sources
Still finding out about failures from support tickets?
Production AI needs more than a green dashboard
Unmeshed gives you step-level visibility into every AI workflow so you can see what failed, which step caused it, and what it received before anything went wrong.