Analyzing Specific Execution
To analyze a specific execution in Unmeshed:
- Login to your Unmeshed account.
- Navigate to the left menu and click on Process Runs.
- Search and open an execution using filters such as process name, status, or process ID.
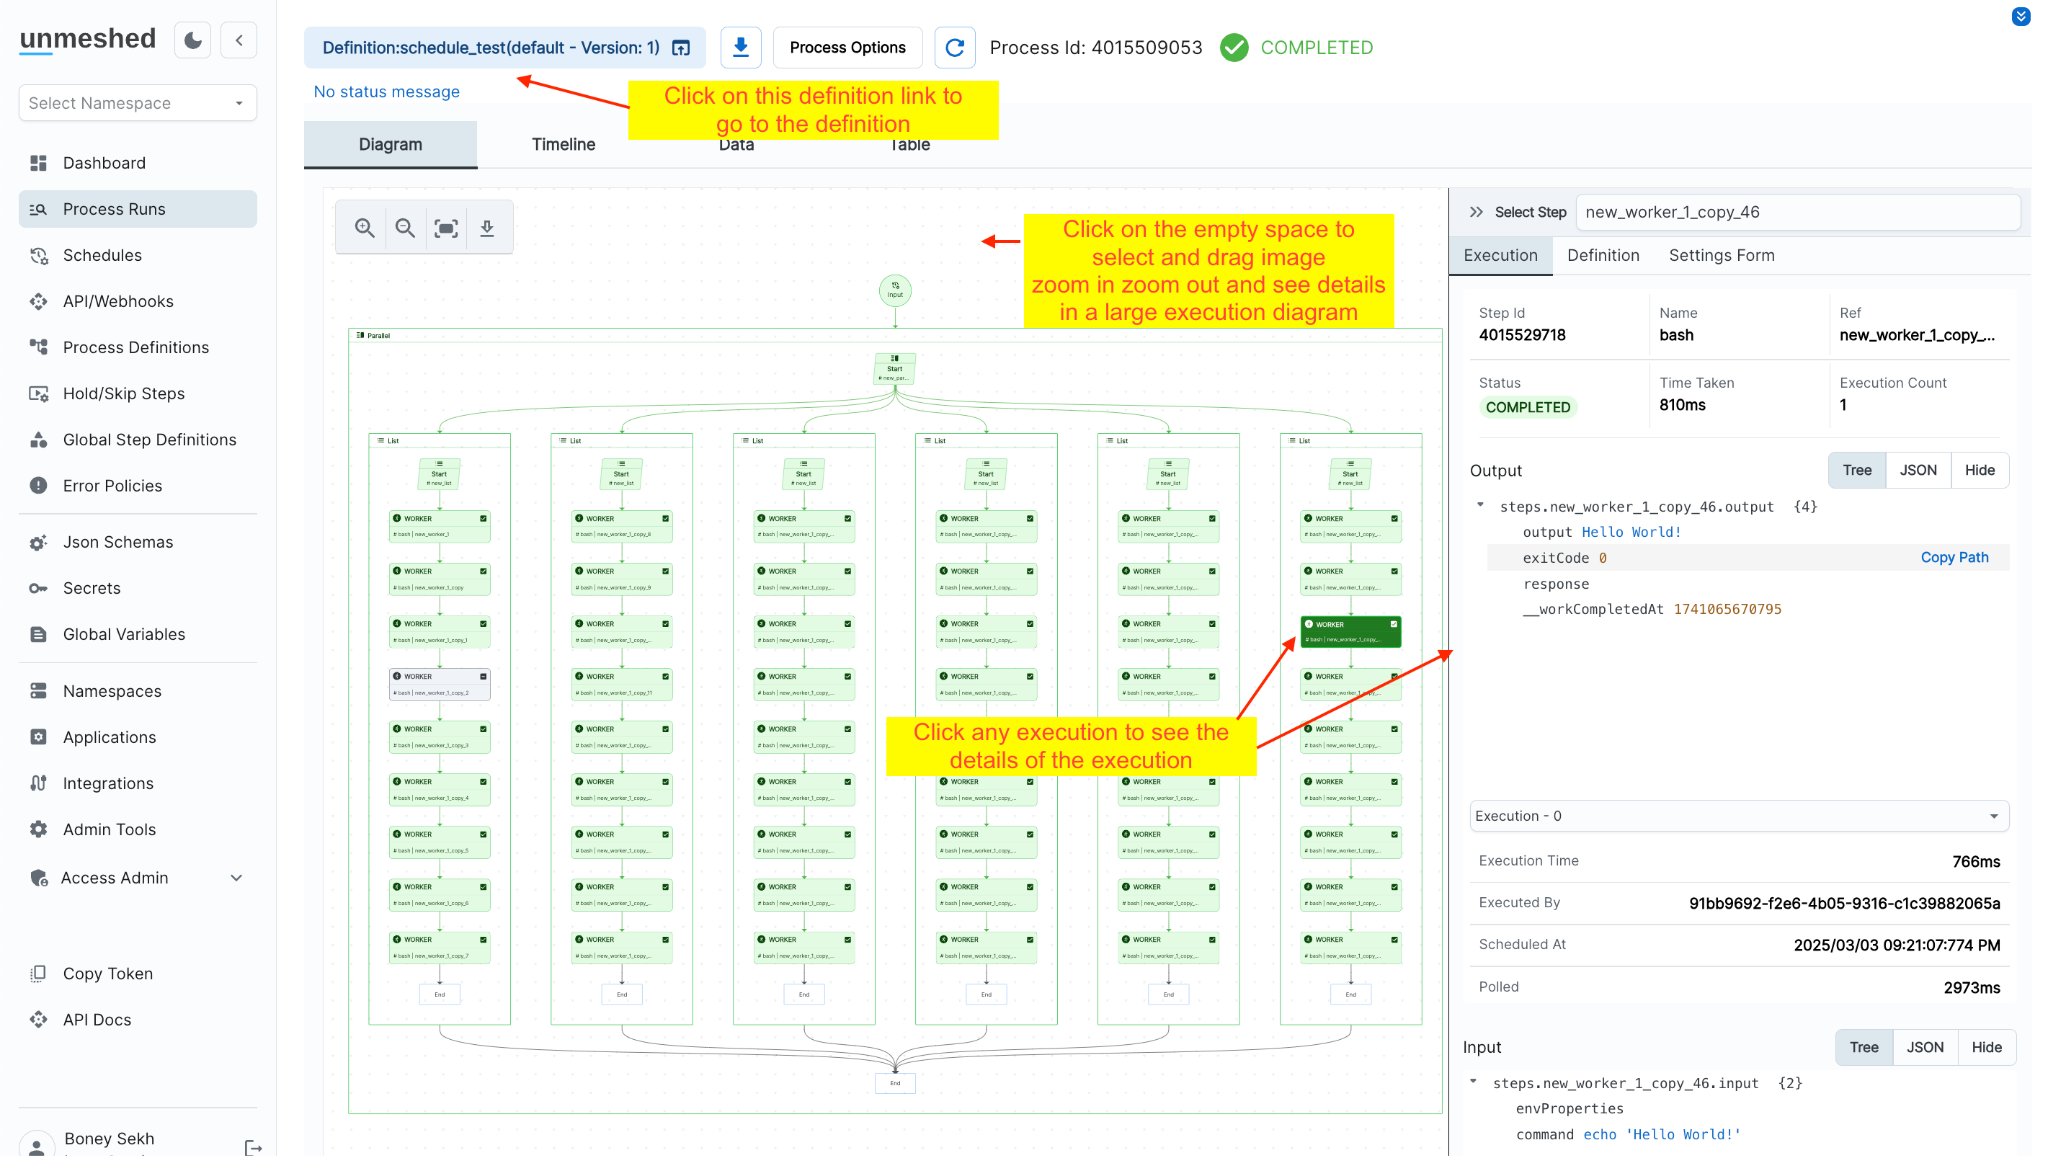
Understanding the Execution View
-
The execution view presents a visual representation similar to a process definition but with colors that reflect status:
- Green: Successfully completed steps.
- Red: Failed steps.
- Blue with a
?icon: Steps yet to be executed. - Grey: Skipped or held steps.
-
Selecting a Step:
- Click on any step (successful or failed) to view detailed execution logs.
- The right panel displays execution status, time taken, inputs, outputs, and additional debugging details.
-
Navigating the Diagram:
- Click and drag on empty space to pan across the execution flow.
- Use zoom controls to inspect different parts of the execution in detail.
-
Direct Navigation:
- Click on the Definition link at the top to open the original process definition.
This guide helps you investigate execution flows, debug failed steps, and monitor system performance effectively.